Apple (AAPL) will report its fiscal Q4 results tonight after the close. The options market is implying about a 5% move in either direction or about $11, which is only a tad rich to the average one-day post-earnings move of 4.3% over the last four quarters, and the 4.5% average move over the last ten years.
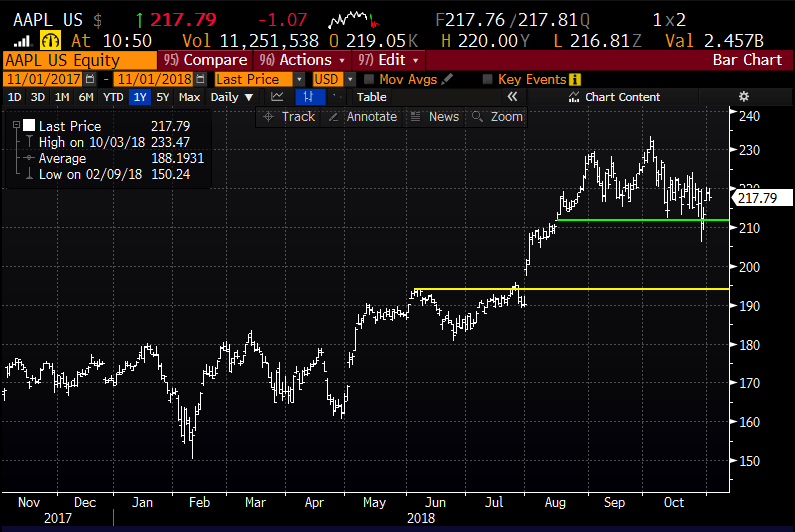
With Amazon’s recent 20% decline over the last month, from its all-time highs, AAPL remains the only public equity on the planet worth more than $1 trillion. Despite the stock’s 6.5% decline from its all-time high made in early October, it is still up and astounding 29% on the year, showing very healthy relative strength to the Nasdaq Composite which is down 10% from its all-time highs made in late September, and the S&P 500 which is down 7.5% from its all-time highs, and only up 6.5% and 1.8% respectively on the year.
To get a sense for the technical set-up in the stock you need to go back to the company’s Q3 post-earnings gap in late July where the stock broke out to new 52-week highs and had a two-day 10% rally before a brief consolidation before making another leg higher into early October. Draw the lines any way you like, but the stock appears to have decent near-term support just below current levels between $210 and $215, but an air pocket below that might include filling in the July earnings gap back towards $195. On the upside, $230 to $233 (the all-time closing high) should serve as near-term technical resistance:
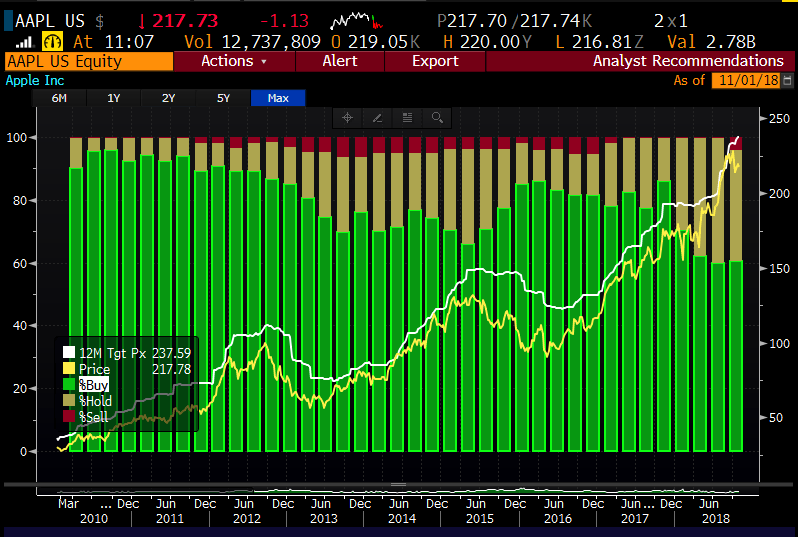
I would add something that caught my eye, that despite the stock’s relative out-performance to the broad market and the MAGA complex (MSFT, AAPL, GOOGL & AMZN) of late, the stock has the lowest percentage of Buy ratings by Wall Street analysts in a decade, per Bloomberg:
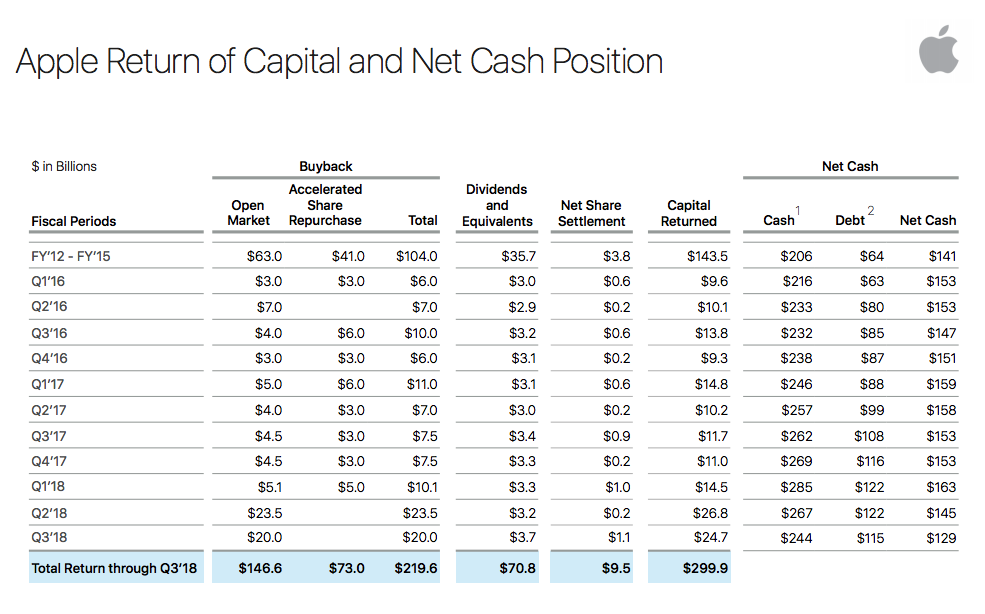
Prior to hitting some of the fundamental drivers for the stock, let’s first address one of the major pillars of the bull case for the stock, repatriation and cash return. Back on May 1st when the company reported their fiscal Q2 results the company suggested they would bring onshore most of the $250 billion in cash and return an additional $100 billion to shareholders in the form of Buybacks and dividends. This number was below what some investors and analysts had expected, but management did suggest they would look to get to equity and debt neutral which could take years given the now $129 billion current gap and the fact that they generate tens of millions of cash a year. As of last quarter, the company will have returned an astounding $300 billion to shareholders since starting their capital return program in mid-2012, which is likely to increase by at least $25 billion since the end of the June quarter:
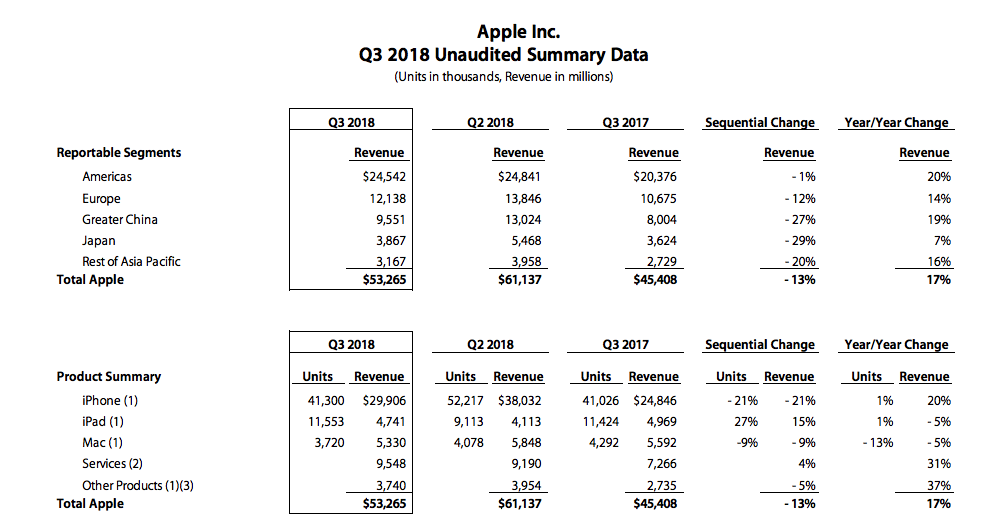
What to expect? On July 31st when the company reported their fQ3 they offered the following guidance for fQ4: 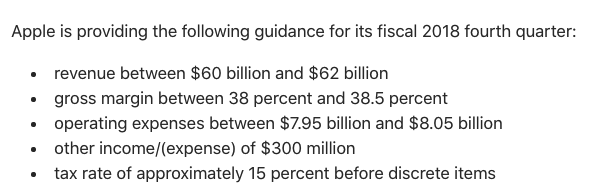
Longtime bull on the stock from Bernstein, Toni Sacconaghi, Jr., who in the last year went to a hold, last week raised his estimates for fQ4 & F19 above consensus:
We are raising our FY Q4 and FY 19 revenue and EPS estimates, largely due to richer ASP assumptions for iPhone and Watch. While Q4 18 results are not important on a standalone perspective, we are ahead of both consensus and guidance largely due to iPhone ASPs.
Overall, we forecast Q4 18 iPhone ASPs of $800, vs consensus at $741, resulting in revenues of $63.3B vs consensus at $61.3B and EPS of $2.90 vs consensus at $2.77.
Part of Toni’s reasoning for his neutral stance on the stock after years of pounding the table is that iPhone units stopped growing year over year and many believed the places where they would be able to grow, primarily emerging markets, where the company faces competition from local lower end players in the smartphone market would ultimately weigh on profitability. But the company has been able to raise the prices for the high-end phones in the developed world, causing average selling prices to go up, and maintain gross margins near 38% company-wide and mid-60s for iPhone. This at a time where services is making up a greater percentage of the total, nearing 15% of sales growing the last qtr at 31%. Lastly, the major deceleration in China sales came to an end the last qtr with sales growing 19% year over year, the first double-digit gain in a while;
As for FY19 guidance and Bernstein’s estimate increase before the quarter, Toni expects ASPs to do the heavy lifting as the company heads into their new fiscal year with two new sized large phones, despite units and margins not expected to grow:
For FY 19, we expect flattish iPhone unit growth and gross margins YoY, but expect notably higher iPhone ASPs ($813 vs. $775), which leads our revenue and EPS estimates to be above consensus forecasts ($291.3B, $14.15 vs. $280.6B, $13.64). That said, we believe that iPhone unit growth is likely to be the critical metric for investors going forward. We see the stock likely continuing to outperform if iPhone units can grow in FY 19, and the stock underperforming if units are down 3% or more. Given that we believe consensus iPhone ASPs are too low for Q4 and Q1, we believe that Apple could potentially guide Q1 in line or above consensus revenues of $92.7B (we are at $95.9B). We would view guidance for sequential revenue growth of >50% as pointing to flattish iPhone unit growth or better.
So what’s my take? I suspect the company hits the guidance they gave for FQ4, despite what might be a messy iPhone unit print given the Sept 21st launch of the iPhone XS and the larger XS Max and the staggered release (Oct 26th) of their lower price large screen XR that falls in size between the XS and the XS Max. Wow, that was confusing, and there is a good chance that consumers might have waited to get their hands on the XR for $800 to see the difference between the $1000 to $1400 XS & XS Max. But I suspect any unit shortfall in the Sept quarter just ended will be picked up in the current quarter, and that guidance will be the thing to drive the stock. I suspect that guidance will be just fine. If I were writing this post a week ago, when high growth high mega-cap stocks like Amazon, Alphabet, Netflix, Facebook, and even Microsoft were in a free fall I might have suggested that anything short of a blowout beat and raise for AAPL and the stock would be on its way back to $200. Oh, what a difference a week can make.
So what’s the trade? I would be surprised if the stock were to massively outperform the implied move tomorrow of about $11. And I would add that the implied move at just a tad above its historical average makes me think that those looking to express directional views can do so fairly cheaply with defined risk. The implied move of $11 means that the at the money straddle (the call premium + the put premium) in the weekly options (that expire to tomorrow) are only offered at about $5.50, or about 2.5% of the stock price.
If I had strong directional conviction, I would target the implied move and consider one of the following defined risk trade ideas:
Bullish Trade Idea: AAPL ($220) Buy Nov 2nd weekly 220 / 232.50 calls spread for $4.30
-Buy to open 1 Nov 2nd weekly 220 call for $5
-Sell to open 1 Nov 2nd weekly 232.50 call at 70 cents
Break-even on Nov 2nd weekly expiration:
Profits of up to 8.20 between 224.30 and 232.50 with max gain of 8.20 above 232.50
Losses of up to 4.30 between 220 and 224.30 with max loss of 4.30 at or below 220
Rationale: this trade idea risks 2% of the stock price, breaking even very near the money. The options market is suggesting there is a 37% probability that this trade is in the money on tomorrow’s close. If you get the direction right there is a good chance that you will at least break-even at some point tomorrow. If the stock is up 5% in line with the implied move you can make almost double the premium at risk.
OR
Bearish Trade Idea: AAPL ($220) Buy Nov 2nd weekly 217.50 / 200 put spread for $4
-Buy to open 1 Nov 2nd weekly 217.50 puts for $4.65
-Sell to open 1 Nov 2nd weekly 200 put at 65 cents
Break-even on Nov 2nd weekly expiration:
Profits of up to 13.50 between 213.50 and 200 with max gain of 13.50 at 200 or below.
Losses of up to 4 between 213.50 and 217.50 with max loss of 4 at 217.50 or higher.
Rationale: This trade idea is slightly out of the money, and the spread is wider than the implied move as I feel that it might be a tad premature to suggest the selling the winner mentality we saw last week is over for 2018. If the company were to unexpectedly guide lower, investors would shoot first and ask questions later, and the stock would very likely outperform the implied move to the downside.
Lastly, a hedge for long holders who want to stay long into the print, but are more worried about the extreme downside in the coming weeks than extreme upside… consider collars… for instance:
Hedge Vs 100 shares of AAPL long at $220 Buy Dec 235 / 205 collar for $1
-Sell to open 1 Dec 235 call at $4.10
-Buy to open 1 Dec 205 put for $5.10
Break-even on Dec expiration:
Profits of the stock (less $1 premium paid for collar) up to $235. The stock would be called away on Dec expiration at $235 with profits capped, but long holder could always cover the short call to keep the long stock position in place.
Losses of the stock (plus the $1 premium paid for the collar) down to $205, but protected below there.
Rationale: if you are long, more worried about a downdraft between now and Dec expiration, than a breakout to new highs, then this hedge idea makes sense for those looking to hold onto the position into the new year but want to define their risk to the downside.