Tomorrow before the open, Spotify (SPOT) will report their Q3 results. The options market is implying about a $15 move in either direction or about 10%, which is nearly double the average of about 5% the stock has moved the day following its first two earnings reports as a publicly traded company.
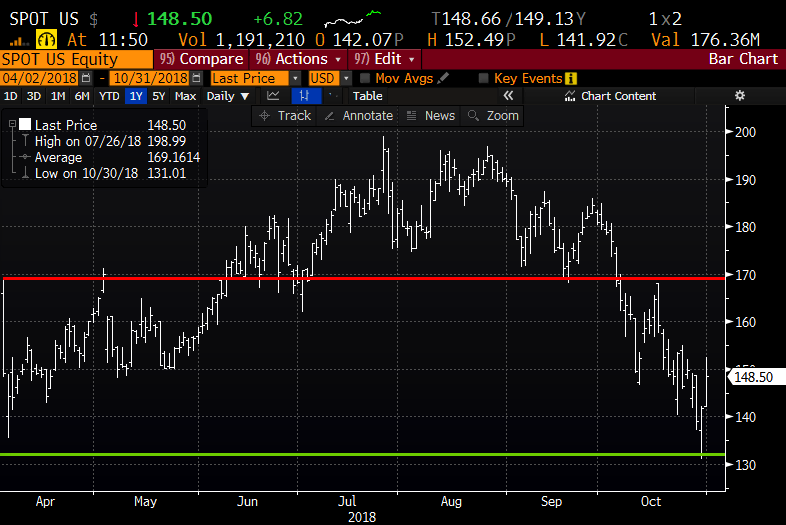
Since listing on the New York Stock Exchange in April through a direct listing with a reference price of $132.50, shares of SPOT have been volatile, nearly touching $200 in late July prior to their Q2 earnings and as lows as $131 yesterday morning, through their listing price, before a 10% bounce in less than two sessions. To my eye, yesterday’s low should serve as important near-term technical support, while the early October breakdown at $170 should serve as near-term technical resistance:
Expectations: Mark Mahaney, RBC’s top-ranked internet analyst who rates shares of SPOT a Buy with a 12-month price target of $215 is…
anticipating Revenue and Operating Loss of €1.32B and (€48MM), respectively, vs the Street @ €1.34B and (€52M). For context, the company’s Q3 Revenue guidance is €1.2-1.4B and Operating Loss guidance is (€90)-(10)MM. We are looking for €1.19B of Premium Revenue in addition to €129MM of Ad-Supported Revenue. Our Q3 estimates forecast 3MM Net New Premium Subscribers Q/Q, slightly below Street estimates and within the company’s guidance of 2-5MM
In a note to clients this week, Mark highlighted the following items to focus on in the quarter:
1) Paid Subscribers: Spotify guided to 85-88MM Paid Subscribers in Q3; we are estimating 86MM, slightly below Street at 87MM, implying 39% Y/Y growth.
2) Premium ARPU: We are forecasting a €4.69 Premium ARPU for Q3, implying 7% Y/Y decline, 5pts above Q2 at -12% Y/Y.
3) Gross Margin: SPOT guided to a 23.7-25.7% Gross Margin for Q3, and both RBC and the Street are forecasting a 25% GM. We note that the company also guided to a 23-25% Gross Margin for 2018 (RBC forecasts 25%).
4) Monthly Active Users: Spotify guided to 188-193MM in MAUs for Q3; we are forecasting 193MM
My Take: SPOT is clearly a unique digital property, but not exactly in the same vane as Netflix (NFLX) which has a fairly similar model. Despite NFLX spending billions of years on original content creation, the company has much higher gross margins at almost 40% vs SPOT at 25%, and higher revenue growth (35%) vs SPOT at 30%, despite being on a much higher revenue base $16 billion vs $6 billion. As Mark mentioned in his note, profitability and monthly active users will be the focus of investors, and a disappointment on either and investors will shoot first and ask questions later. A beat and raise has the stock up near the 10% implied move in my opinion, but much like NFLX two weeks ago, it might be met with selling as some investors who thought the stock’s sell-off from nearly $200 in the summer was getting overdone might look for any pop to get out as the mood has clearly changed a tad towards high valuation, high growth stocks like NFLX and SPOT.
So what’s the trade? Options premiums are through the roof, as I said above the implied move, which is the at the money weekly straddle (the call premium + the put premium) is offered at about $15. So if you were inclined to make to make an at the money directional bet into the print by buying a put or a call it would cost you 5%, that is what you would risk and need to clear in two trading days. Regular readers know our view on long premium directional trades into events like earnings, specifically buying puts or calls outright, even with a lot of conviction, you need to get a lot of things right to merely break even, first and foremost direction, then the magnitude of the move and of course timing, as it is ticking against you.
If I were inclined to make a bullish bet I might look to target the implied move, but choose a structure like a butterfly to help put the odds of break-even in my favor, for instance…
Bullish Trade Idea: SPOT ($150) Buy Nov 2nd weekly 155 /165 / 175 call butterfly for 1.70
-Buy to open 1 Nov 2nd weekly 155 call for 4.15
-Sell to open 2 Nov 2nd weekly 165 calls at 1.40 each or 2.80 total
-Buy to open 1 Nov 2nd weekly 175 calls for 35 cents
Break-even on Nov 2nd weekly expiration:
Profits of up to 8.30 between 156.70 and 173.30 with max gain of 8,30 at 165
Losses of up to 1.70 between 155 and 156.70 & between 173.30 and 175 with max loss of 1.70 below 155 and above 175
Rationale: this trade targets the 10% implied move over the next two trading days, get the direction wrong and the trade will be a total loser, but it is only risking 1.1% of the stock price, with about a 30% chance of break-even on Friday’s close and only an 18% chance of max profit at $165 on Friday’s close. So the odds are not great, but the premium at risk is not aggressive. while offering nearly a 5 to 1 potential payout.
Or if you are inclined to play for a miss and guide down then I think it makes sense to give yourself a little more time than the weekly, and target yesterday’s low near $130:
Bearish Trade Idea: SPOT ($150) Buy Nov 16th 145 / 130 / 115 put butterfly for $2.50
-Buy to open 1 Nov 16th 145 put for $6.50
-Sell to open 2 Nov 16th 130 puts at $2.35 each or $4.70 total
-Buy to open 1 Nov 16th 115 put for 70 cents
Break-even on Nov 16th close:
Profits of up to 12.50 between 142.50 and 117.50 with max gain of 12.50 at 130
Losses of up to 2.50 between 142.50 and 145 & between 115 and 117.50 with max loss of 2.50 below 115 or above 145
Rationale: like above, this trade targets an important level, in this case a spot where the stock might find some support in the coming days if it overshoots the implied move. This trade also offers about a 5 to 1 payout which is an attractive risk reward when chosing a butterfly.