Facebook (FB) will report their Q3 results tonight after the close. The options market is implying about a $13.50 move in either direction or about 9.5%, which is slightly rich to its 8.5% average over the last four quarters, which was massively skewed by its 19% one day drop on July 26th following their disappointing Q2 results.
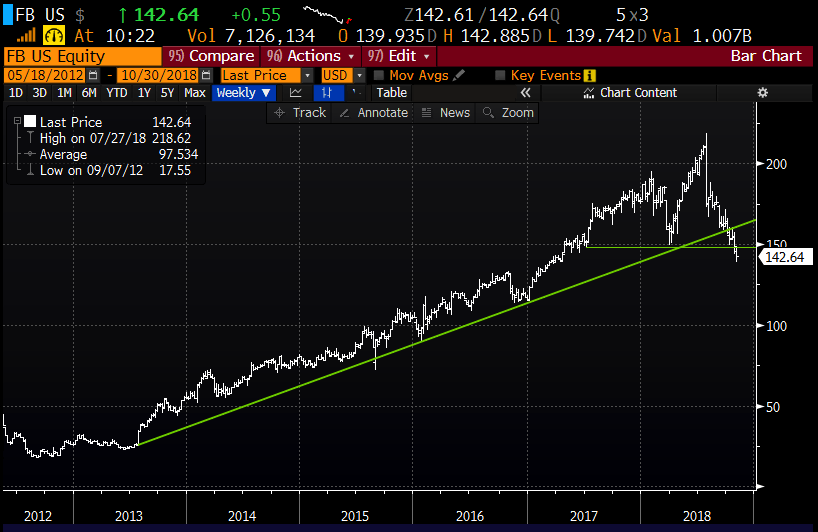
Shares of FB are on the precipice of having its first annual decline since its first year as a public company this year, down 19.5%, and down 35% from its all-time highs made in late July. The technical set up is a bit of a mess, with the stock through its 2018 lows made in late March, and now through the uptrend that had been in place since its 2013 lows:
Despite the stock’s ytd performance, Wall Street analysts remain overwhelmingly bullish on the stock with 42 Buy ratings, Holds and only 2 Sells. One Buy rated analyst, RBC’s Mark Mahaney who has a 12-month price target of $225 highlights the following ‘Key Items to Focus On’:
1) User Growth and Engagement: In Q3:18, we are estimating Y/Y MAU growth of 11% to 2.30B. For Q3, we are also estimating a slight Q/Q decrease in the DAU/MAU ratio to 65.7%, down 30bps Y/Y. In the key European market, we would expect both MAUs and DAUs to regain track to grow Q/Q vs Q2:18 Q/Q declines likely due to GDPR implementation static.
2) Advertising Revenue Growth: For Q3, we are modeling an Ad revenue growth rate (ex-FX) of 34% Y/Y, down from 38% in Q2 on a 2-pt easier comp.
3) Margin Levels: For Q3, we are looking for 44% GAAP operating margin, down 537 bps Y/Y, and a 61% Adjusted EBITDA margin, down 555 bps Y/Y
On Friday prior to Options Action on CNBC, I posted some thoughts on expectations into the print, that I titled “Threading a Falling Needle”:
If the company were to miss already lowered estimates in the current environment then the stock is likely to be down in-line with the implied move. But if the company were to beat and raise the stock is up 10% quickly!
At this point, it makes sense to focus on valuation, which I think will be a key determinate once it appears the coast is clear on further guide downs. FB trades at 18.50x expected 2019 eps growth of 13%, which I suspect is low when you consider that sales are expected to rise 24% from $55 billion this year to $68 billion next. Obviously, a big reason for the deceleration in eps growth is the increase spend to shore up security on the platform which has resulted in lower gross margins, which this year are expected to be 4 points below their 2016 peak of 87.5% and decline to 82% in 2019. What could cause GMs to go back up next year, moderated spending on from 2017 & 2018 levels and the ability to monetize properties like WhatsApp and their 1.5 billion monthly active users?
And detailed a trade strategy to play for a 10% rise in the coming weeks but really sets up to own out of the calls in January, click below:
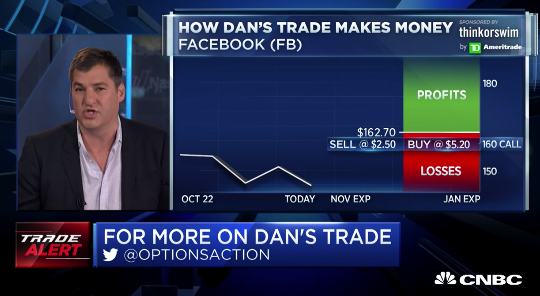
So what’s the trade? If you want to be a bit contrarian and try to catch a falling knife, you have to first get through next weeks earnings and mid-terms without any major issues and the stock could set up as a good long candidate into the new year. Sell short-dated out of the money calls to finance owning longer-dated out of the money calls….
BULLISH TRADE IDEA: FB ($145) BUY NOV / JAN 160 CALL CALENDAR FOR $2.70
-Sell to open 1 Nov 160 call at $2.50
-Buy to open 1 Jan 160 call for $5.20
Break-even on Nov expiration:
The ideal scenario is that FB stock is near 160 on Nov expiration and the short 160 call expires worthless or can be covered for a small amount and you are left long Jan 160 call for $2.70 or less than 2% of the stock price.
The max risk of the trade is $2.70 on a sharp move lower than current levels or a sharp move above the $160 strike price.
As I have suggested in the last few posts (here, here, here & here). it might take one more guide down before investors think the coast is clear for the company, where forward estimates would be hard to miss, and that valuation is too cheap to ignore, despite risks of future regulation.
So what’s the trade? I still like the idea of call calendars for those looking to be contrarian, but with the stock down almost $4 since Friday it might make sense to consider a slightly lower strike, like the $155s.
On the downside, if I were considering pressing the stock on the short side, targetting a 10% move to the downside I would consider put spreads in weekly options, for instance:
Bearish Trade Idea: FB ($141) Buy Nov 2nd weekly 137 / 127 put spread for $3
-Buy to open 1 Nov 2nd weekly 137 put for $4.30
-Sell to open 1 Nov 2nd weekly 127 put at $1.30
Break-even on Nov 2nd weekly expiration (Friday):
Profits of up to 7 between 134 and 127 with max gain of 7 at 127 or lower
Losses of up to 3 between 134 and 137 with max loss of 3 at 137 or higher
Rationale: short-dated options are expensive, and as always, long premium directional trades are challenged into events like earnings as you need to get a lot of things right to just break-even, direction, magnitude of the move and timing. But for those convicted that the stock could decline 10% nearly in-line with the implied move, then risking 3, or 2% of the stock price to make possibly 7, or 5% is a decent risk-reward.