The S&P 500 (SPX) is down nearly 4% from its all-time highs made last month, approaching what some might view as an important technical level in 2800, just above its 200-day moving average:
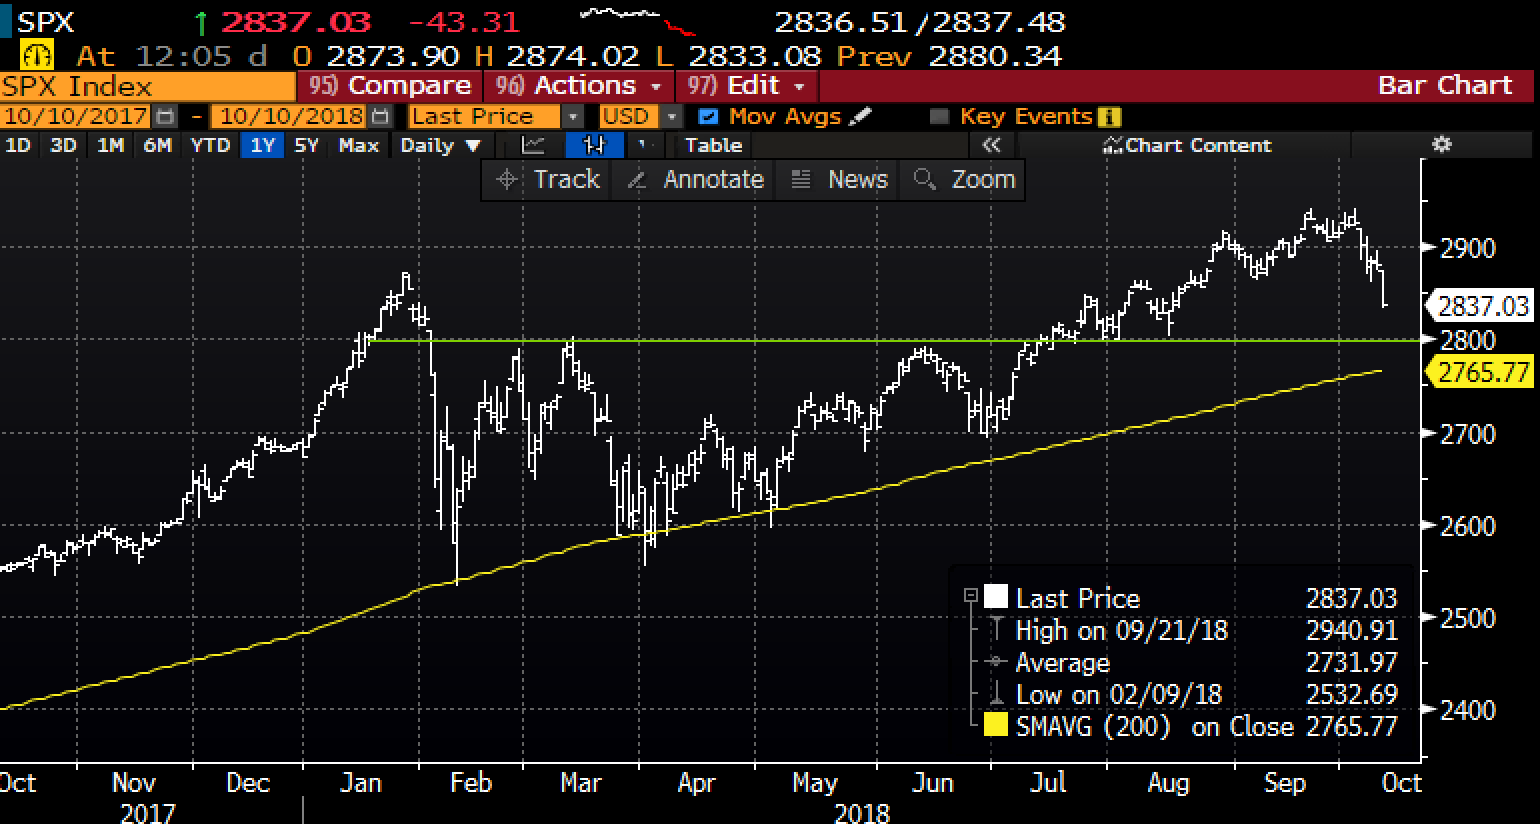
I suspect there will no shortage of dip buyers if we continue back towards 2765, as investors have become accustomed to stepping in at key support levels, but at those levels the SPX would be down just 6% from the Sept highs, which would only be about half of the peak to trough decline we had back in January – February of this year. I am not suggesting the SPX is a good press on the short side here, merely that it might set up as a good candidate to sell rallies if we are to go into a broader corrective phase.
Why might we have a 10% peak to trough correction youa ask? Well, the level of uncertainty surrounding a few key factors to equity returns after such an epic run and period of accommodative monetary policy that has clearly come to an end:
-U.S. Rates and Dollar Rise could negatively impact global growth, which U.S. multi-nationals will become increasingly reliant on for incremental growth as the positive short-term effects of last year’s tax cut wane.
-Uncertainty from the brewing trade war with China is causing supply chain disruptions and might have caused many U.S. companies to double order in the first half of the year, pulling forward demand and possibly causing and inventory build that could take months if not quarters to alleviate and weigh on pricing.
–Despite 18 year highs in consumer confidence, the ability of companies to pass through higher input costs to consumers, at a time when we are starting to see wage inflation could be a double edge sword for the economy, and the markets, just as higher rates are causing credit conditions to get tighter, as the housing market is weakening. A precipitous drop in risk assets could mark a double top in consumer confidence and possibly becoming a self-fulfilling prophecy.
-Mid-terms, while it has kind of been smooth sailing since the early hours of November 2016, there was considerable volatility into the lead up to that election, and I think it is safe to say that the geopolitical world we live in today is far more contentious than it was two years ago, and the stakes could be much higher now.
On last night’s Fast Money on CNBC we discussed some these issues that could be weighing on investors sentiment, (click below to watch), and I could not help to point out that some of the most economically sensitive groups in the market act very poorly:
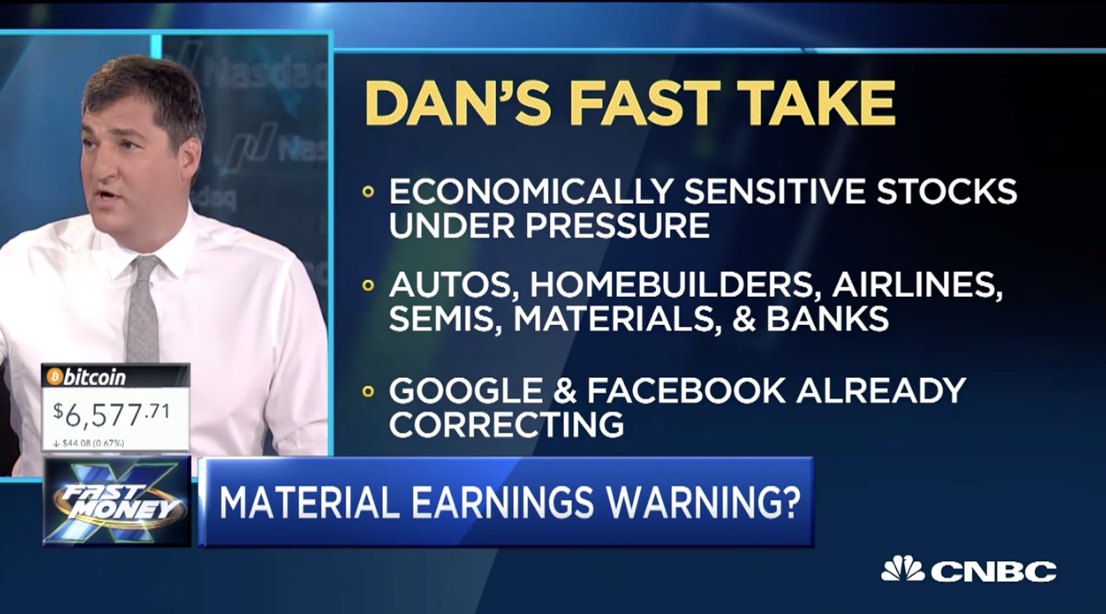
So how is it that we are seeing new 52-week lows (many in serious correction territory) by some of the most economically sensitive groups in the market and the SPX is less than 4% from its highs and still up 6% on the year, and up 12% from the 52-week low made in January when investors had similar concerns as to they do now? The answer is quite simple MAGA… Microsoft (MSFT) Apple (AAPL), Alphabet (GOOGL), and Amazon (AMZN), make up $3.6 trillion in market cap, or about 15% of the weight of the SPX, despite their recent collective declines, they are up massively on the year, especially for their size,: MSFT up 27% ytd, AAPL up 32%, GOOGL up 7% and AMZN up 55%. They more than make up for all of the ytd performance in the index and shit-ton of the bad performance.
As for the bad performance, and considering some of the economically sensitive groups listed above, we are seeing new 52-week lows in American Airlines (AAL), Applied Materials (AMAT), General Motors (GM), Lennar (LEN), the Materials etf, XLB, and then there is Blackrock (BLK), the largest asset manager in the world, with $6 trillion (for now). Yesterday I tweeted the following…
What’s up with the divergence from the January 2018 highs between @Blackrock $BLK (the largest global asset manager ~ $6 trillion) and the S&P 500 $SPX?
“One dog goes one way, the other dog goes the other way and this guy’s sayin’… “Whadda ya want from me?’ pic.twitter.com/AH2rKYH021
— Dan Nathan (@RiskReversal) October 9, 2018
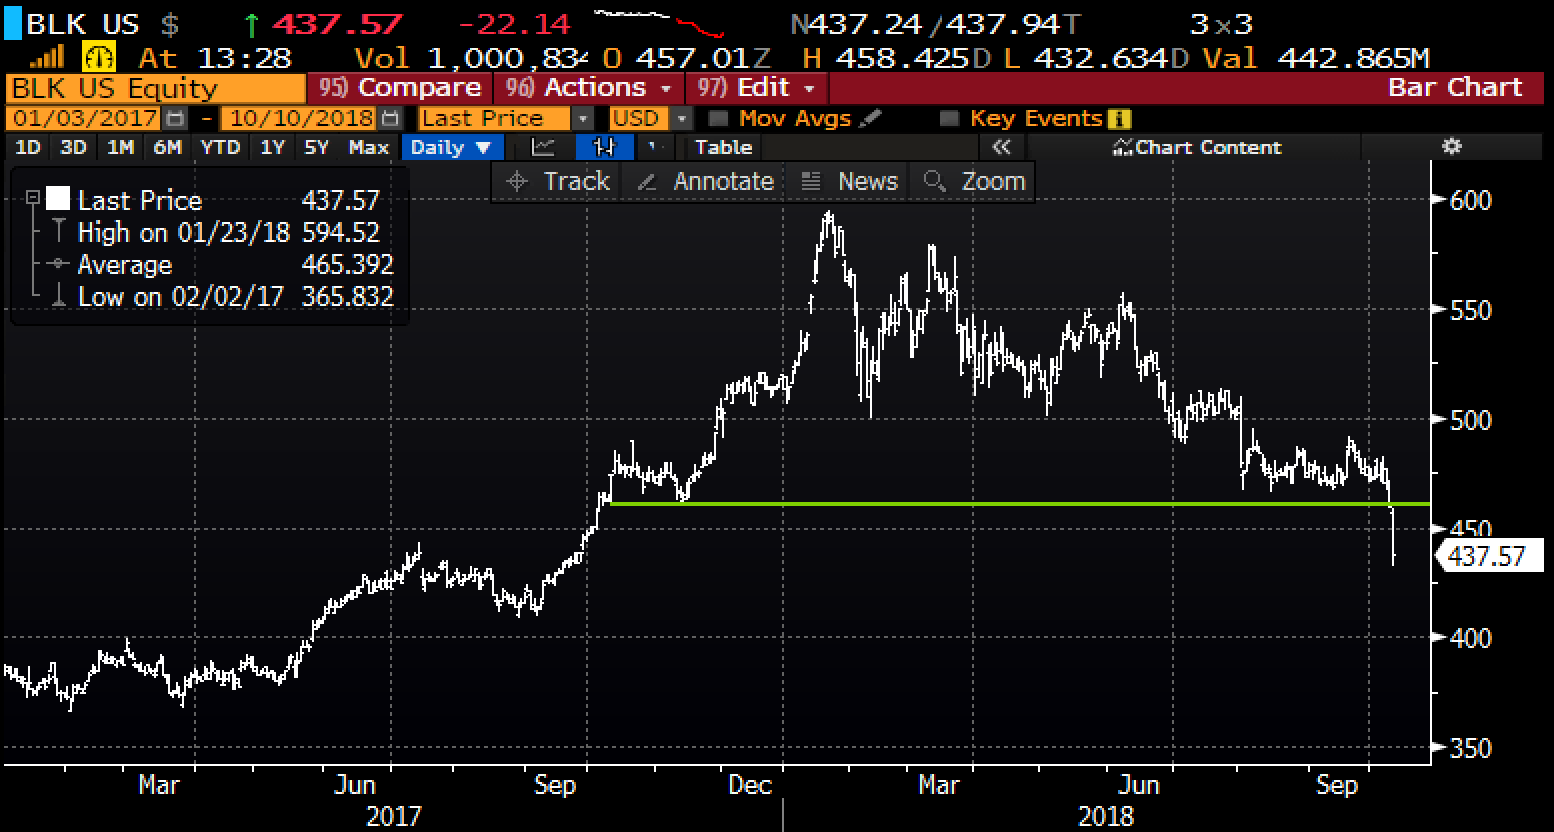
Here it is today…
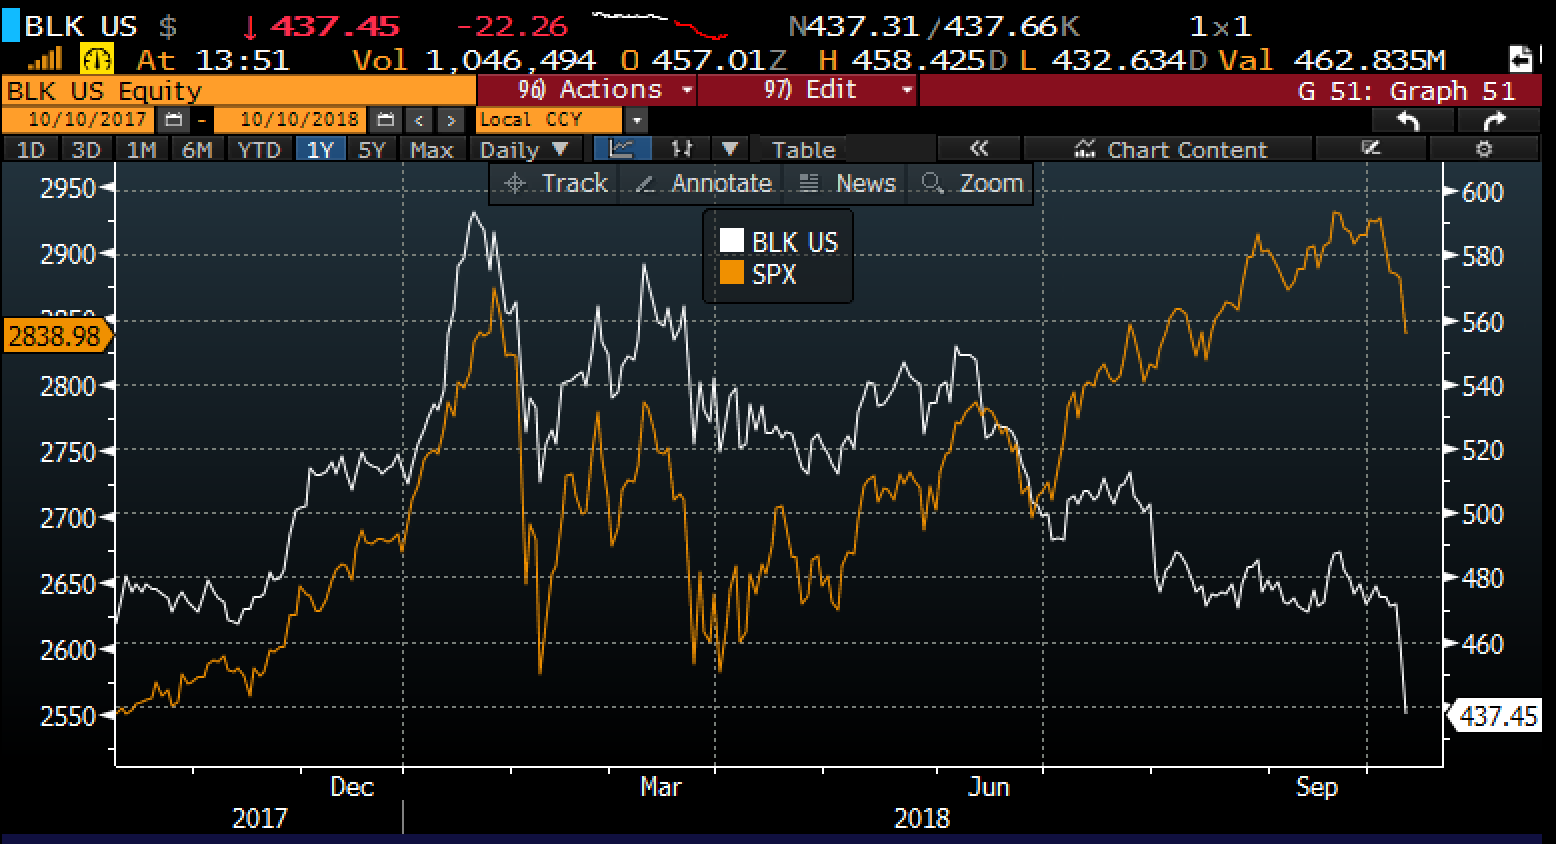
That is one very odd divergence, and one nasty looking chart, with today’s nearly 5% drop putting it an all-out crash mode, down 26% from its 52-week and all-time highs made in January when the S&P 500 was at its prior all-time highs. To answer my own tweet, I am not sure what it is saying but it aint good…
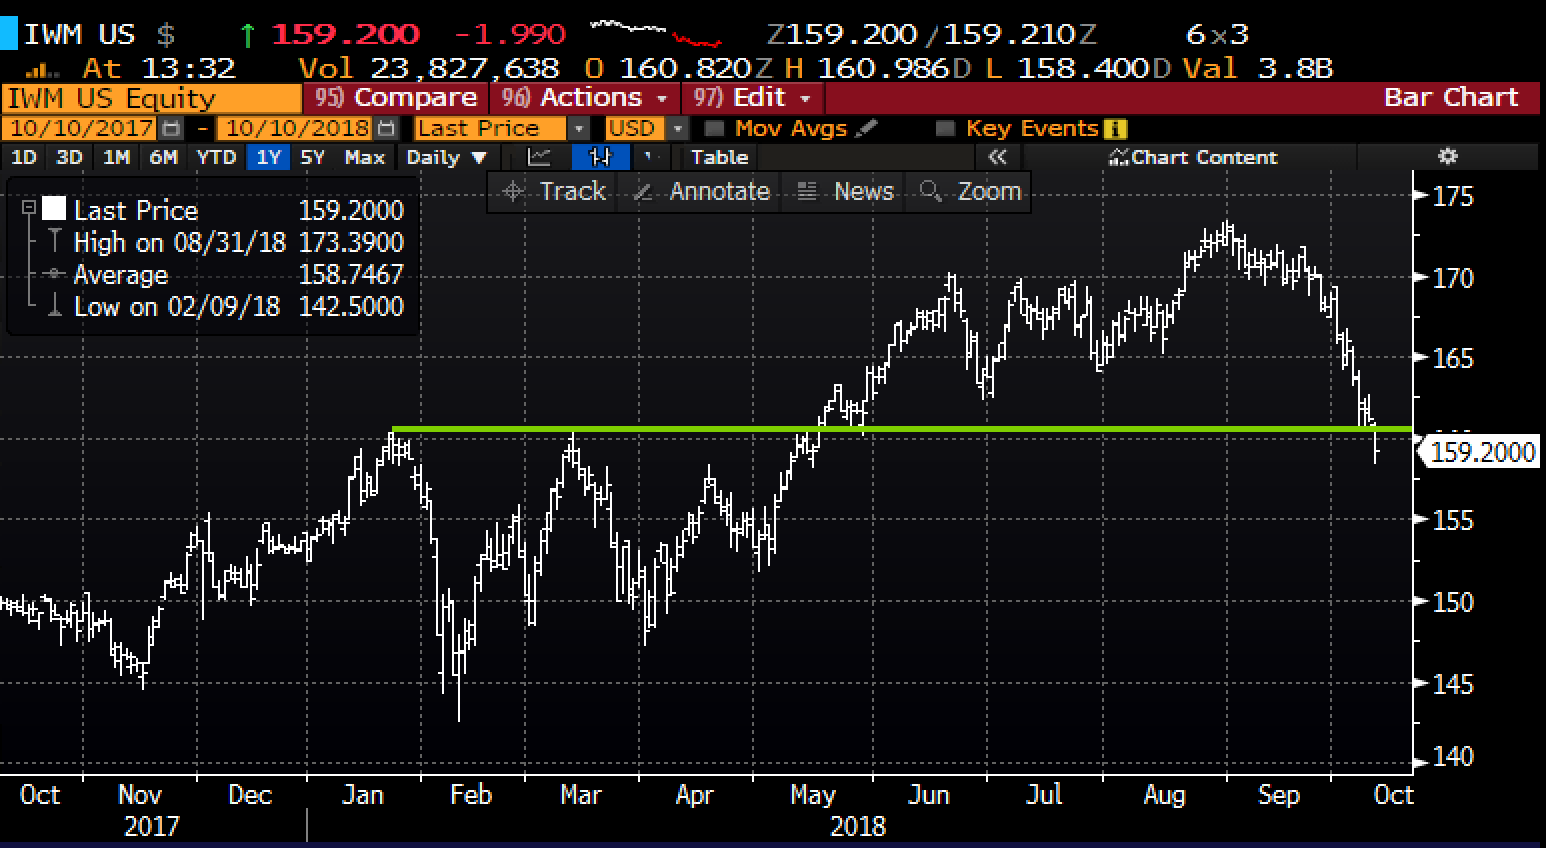
Oh and one more thing, keep an eye on small-caps, as measured by the IWM, which is still up 6.5% on the year, but in the last few weeks has given back all of its out-performance to its large-cap brethren, or about 8% and has today blasted through the $160 level which was an important technical resistance level until its May breakout:
SO what’s the trade?? I have no idea really. Regular readers know that what I wrote above are themes I have been revisiting in individual posts, stock by stock, or etf by etf for a few weeks now. BUT I would add that the lower we go into earnings season, which starts in earnest this Friday morning with 25% of the weight of the S&P Financial Select etf reporting (JPM, C, WFC and PNC) I would become increasingly cautious about pressing shorts. The slightest bit of good news after a sharp drop and you will see painful short squeezes…. That said they could prove to be nothing other than relief rallies, but I suspect that companies that have shown relative strength, and surprise to the downside on earnings and guidance, we will see our share of bloodbaths.
With this backdrop, we will be sure to give special focus to MAGA and banks before their reports.