As regular readers know I spend a few hours a week, aside from Risk Reversal publicly commenting on the stock market on CNBC. As many of you do, I have the network on throughout the day and I have always found it interesting how certain themes make it their way through punditry circles. One such theme in 2018 is that bank stocks, or as the pundits refer to them on tv “financials” are just waiting to explode giving the rising interest rate environment, and last years tax cuts and the subsequent boost to GDP should be a boon to the group. If all of that is true, why is it that the only major U.S. bank stock to keep pace with the broad market is JP Morgan (JPM), both in terms of year to date gains and having just made a new all-time high last week with the S&P 500 (SPX)? Why is it that Bank of America (BAC) the only other major bank stock in the U.S. that is up on the year (4%) is still down 7% from its 52-week and ten-year highs made in March? Why is it that premier investment banks like Goldman Sachs (GS) and Morgan Stanley (MS) are down 9% / 8% and 16% / 18% on the year and from their 52-week highs respectively?
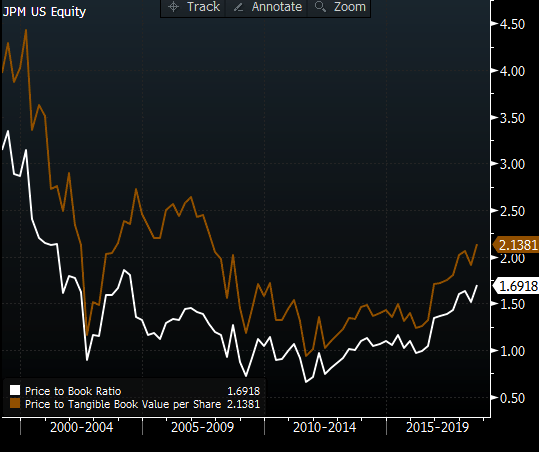
On Sept 12th I detailed a bearish trade idea in the XLF, the etf that tracks the bank stocks, so I won’t go into further detail (read here), but lets not focus on the underperformers, at this point they very clearly discount what is likely to be a Q4 and Q1’19 slowdown in U.S. growth. But what if anything is JPM, less than 2% from its all-time highs is it discounting, trading 12x next year’s expected eps growth while book value is very near the pre-crisis levels despite lower leverage ratios:
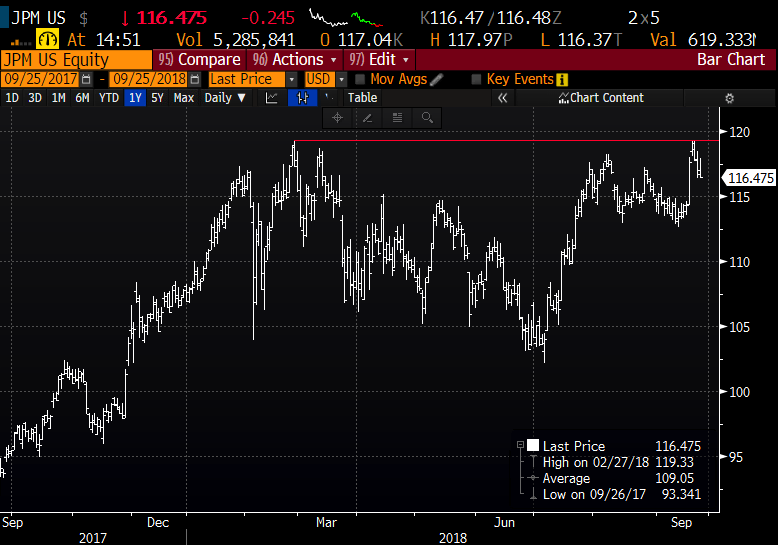
And wow, look at the one year chart of JPM, it stopped on a dime last week at the prior high from January, making a very tidy double top:
The next identifiable catalyst for JPM shares will be their Q3 earnings on the morning of October 12th.
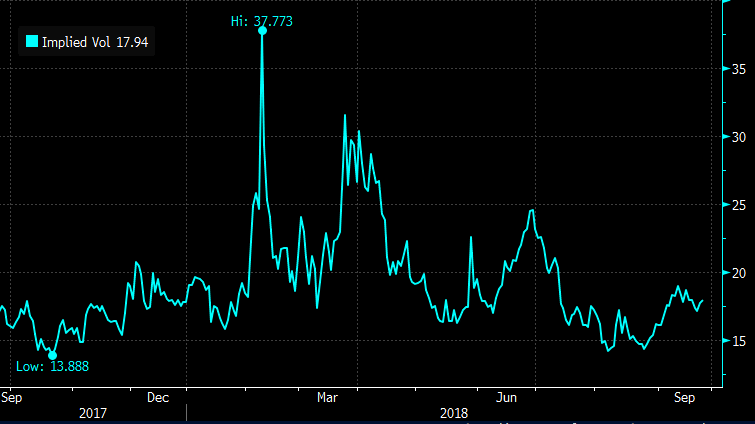
Short-dated options prices are fairly cheap, with 30 day at the money implied volatility just below 18%, with the options market pricing only a 3.5% move between now and the close on Oct 12th:
So the funny thing about drawing lines on charts is that people often see what they want to see. That straight line just above $119 looks like formidable technical resistance. But if it were to get through there, well who knows, maybe it goes up 5% in a straight line on the breakout. On the flip-side, if you were bearish you might use that level to stop yourself out on the short side. One way to target the earnings event could be using a call or a put calendar, focusing on overhead resistance or downside support and looking to sell shorter dated options of a nearer expiration and using the proceeds to help finance a longer dated options that expire on the afternoon of earnings. For Instance…
If you thought that JPM will issue a beat and raise and the stock could gap higher after earnings, consider:
Bullish Call Calendar: JPM ($116.50) Buy Oct 5th / Oct 12th 119 call calendar for 40 cents
-Sell to open 1 Oct 5th weekly 119 call at 30 cents
-Buy to open 1 Oct 12th weekly 119 call for 70 cents
Break-even on Oct 5th expiration:
IF JPM is 119 or lower the short Oct 5th 119 call will expire worthless and you will own the Oct 12th 119 call for 40 cents for earnings, at which point you could sell a higher strike call in Oct 12th expiration and further reduce the premium at risk making a vertical call calendar.
Or if you thought the stock could trend lower next week and breakdown after earnings, consider:
Bearish Put Calendar: JPM ($116.50) Buy Oct 5th / Oct 12th 114 put calendar for 50 cents
-Sell to open 1 Oct 5th weekly 115 put at 65 cents
-Buy to open 1 Oct 12th weekly 115 put for $1.15
Break-even on Oct 5th expiration:
IF JPM is 115 or higher the short Oct 5th 115 put will expire worthless and you will own the Oct 12th 115 put for 50 cents for earnings, at which point you could sell a lower strike put in Oct 12th expiration and further reduce the premium at risk making a vertical put calendar.
Both trade ideas risk less than half a percent of the stock price and target an event, some might look at a trade like this and suggest you are attempting to thread a needle but the way I see it is that merely buying a shorted dated put or a call into earnings has a very lower probability of success as you need to get a lot of things right to merely break-even, like direction, timing and magnitude of the move. Calendars offer some otpionality.