Red Hat Inc (RHT) will report their fiscal Q2 results today after the close. The options market is implying about a 8.3% move between now and Friday’s close, which is rich to the stock’s ~6% average one-day post-earnings move over the last four quarters and the nearly 7% average over the past ten years. With the stock at $141, the Sept 141 straddle (the call premium + the put premium) is offered at about $11.70, if you bought that and thus the implied movement you would need a rally above $152.70 or a decline below $129.30 to make money and earn out the implied movement by Friday’s close.
I suspect RHT’s 14% one day drop on June 22nd following their disappointing Q2 and full year guidance that came in below expectations, that had been reiterated the prior month at their analyst day. To the CEO’s credit, he went on Jim Cramer’s show Mad Money the day of the drop and answered some tough questions about how they handled the release (watch here) and intimated that they have had one-quarter blips in the past.
Despite RHT’s 20% drop from its all-time highs in June is still up 17% on the year, and up more than 100% from the start of 2017. It just so happens to be sitting on that massive uptrend from its lows in early 2017:
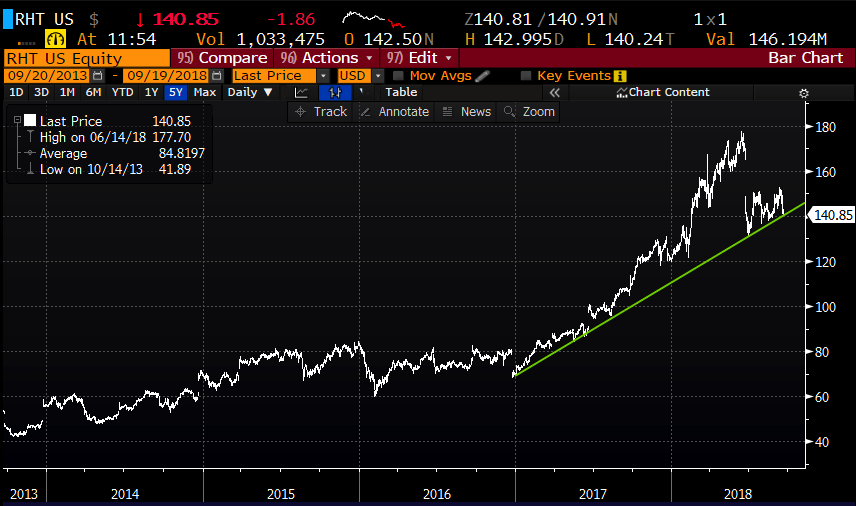
Taking a look at the one year chart, the next level of support (aside from the 18-month uptrend) is the July low near $130, then 2018 low in February near $120. To the upside, the breakdown level from June near $150 back up towards the gap at $165 should serve as a target to the upside, but also healthy technical resistance:

RHT is not exactly a cheap stock, trading 40x expected fiscal 2019 eps growth of 16% and 7.35x sales expected to grow to $3.4 billion at 16%. Wall Street analysts are fairly mixed on the stock, with 15 Buy ratings, 11 Holds, and 3 Sells. I don’t have a strong opinion on the name one way or the other aside from the fact that the stock could easily move in line with the implied move if one of two things happened. If the company guided Q2 low enough and they were actually able to beat and raise, then the stock is somewhere back in last quarters earnings gap above $150 on its way to filling. But a second consecutive guide lowe and the stock is on its way to that support zone between $130 and $120.
So what’s the trade? Weekly options are brutal for long premium directional trades into the print. For instance with the stock just below $141, the Sept 140 / 130 put spread would cost about $4, or about 40% the width of the near the money spread. As we often discuss for long premium event trades, you need to get a lot of things right to just break even, direction, timing and magnitude of the stock’s move. In this case, risking 4 to possibly make 6 (or 1.5x) if the stock is down nearly 8% in two trading days. That is not exactly a great risk-reward trade in my opinion.
It makes sense to extend the time to realize the direction if in fact, you are inclined to pick a direction.
If I were bearish (or seeking protection for a long position) and thought the earnings could be a catalyst for a move lower I might consider the following trade idea in Oct expiration:
Bearish Trade Idea: RHT ($141) Buy Oct 140 / 120 Put Spread for $5
-Buy to open 1 Oct 140 put for 6.25
-Sell to open 1 Oct 120 put at 1.25
Break-even on Oct expiration:
Profits up to 15 between 135 and 120 with max gain of 15 at 120 or lower
Losses of up to 5 between 135 and 140 with max loss of 5 above 140
Rationale: risk 1 to possibly make 3, or 25% the width of the near the money spread with 1 month to expiration.
Or If I thought the company would issue a beat and a raise and the stock would fill in the late June earnings gap I might consider the following….
Bullish Trade Idea: RHT ($141) Buy Oct 145 / 165 Call Spread for $4.25
-Buy to open 1 Oct 145 call for 5.25
-Sell to open 1 Oct 165 call at 1
Break-even on Oct expiration:
Profits of up to 15.75 between 149.25 and 165 with max gain of 15.75 at 165 or higher.
Losses of up to 4.25 between 145 and 149.25 with max loss of 4.25 below 145
Rationale: this trade has a slightly better potential payout, but its break-even is further out of the money making the probability of success less than the put spread described above. Riskin 3% of the stock price for a break-even up nearly 6%.