On Wednesday I detailed a bearish trade idea in the XLF, the etf that tracks the bank stocks, targeting the bulk of the largest components Q3 earnings that fall in the second and third week of October (read below). I wanted to offer an alternative trade idea in the XLF that I will detail on tonight’s Options Action on CNBC, for all of the same reasons listed below, but merely widening out the put spread a tad and lengthening the duration a bit to November expiration from October 26th weekly expiration. Same idea, slightly different trade structure:
XLF $28.20 Buy Nov 28 / 26 put spread for 40 cents
-Buy 1 Nov 28 put for 58 cents
-Sell 1 Nov 26 put at 18 cents
Break-even on Nov expiration:
Profits of up to 1.60 between 27.60 and 26, max gain of 1.60 below 26
Losses of up to 40 cents between 27.60 and 28 with max loss of 40 cents above 28
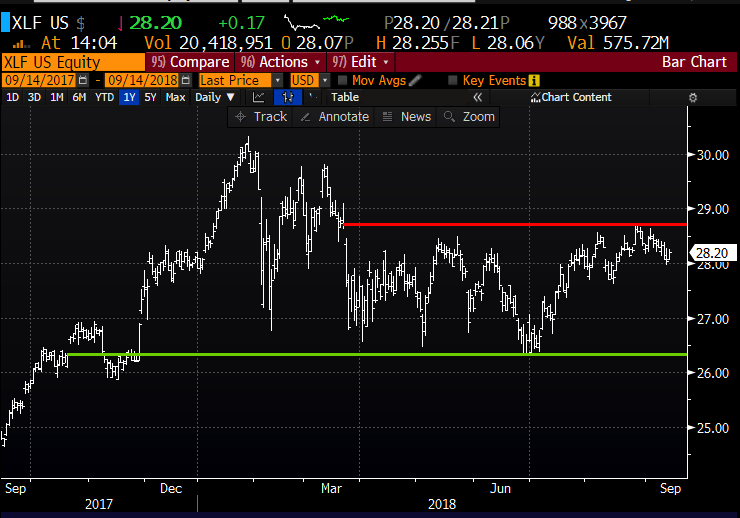
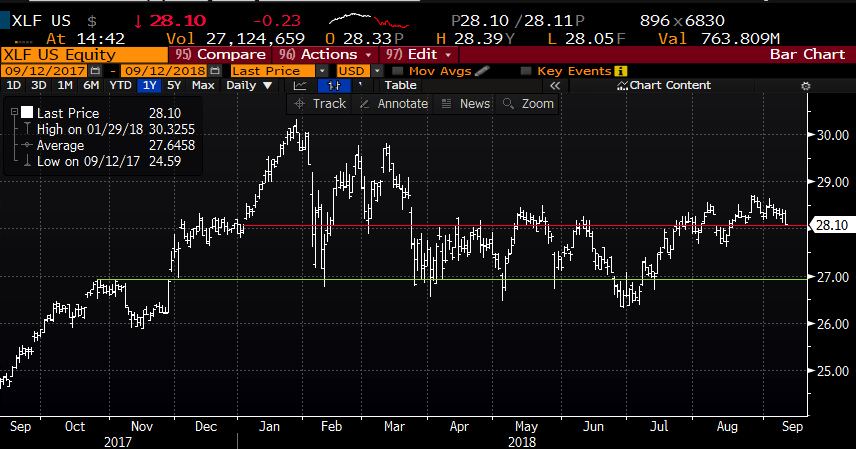
Rationale: risk 1.5% for a break-even down 2% with profit potential of up to 5.5% of the stock price. To my eye, the XLF has decent near-term technical resistance near $28.75 at the mutli-month high made in August and healthy support near the July low at about $26.25. This trade idea defines my risk to that range to the upside and offers profit potential to the downside for the next two months.
_____________________________________________________________________
September 12th, 2018:
XLF… ‘You Come At the King, You Best Not Miss’
It has been a fairly newsy day for bank stocks… Let’s start with some news out of Barclay’s Bank conference where Citigroup’s CFO John Gerspach offered some commentary on Q3 trading and Investment banking activity, which largely looked in-line with “seasonal” but suggested that longer-term profitability targets will be higher due to lower taxes and decreased costs in a presentation. Shares of Citi opened up 3%, is up 2% as I write…
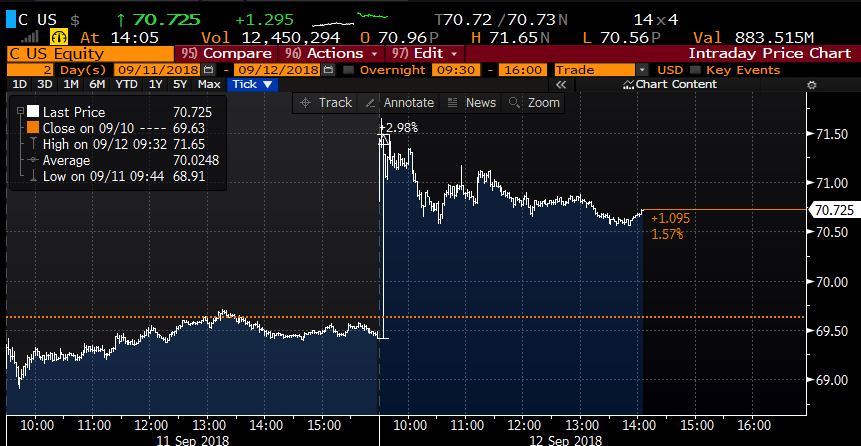
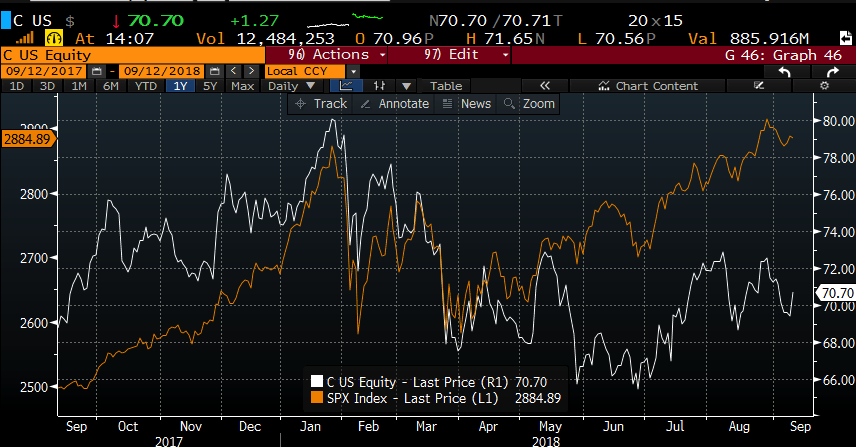
Yet the stock is still down 5% on the year and down 10% from its 52-week highs made in January, massively underperforming the S&P 500’s 8% ytd gains, I’d say today’s price action is fairly unimpressive:
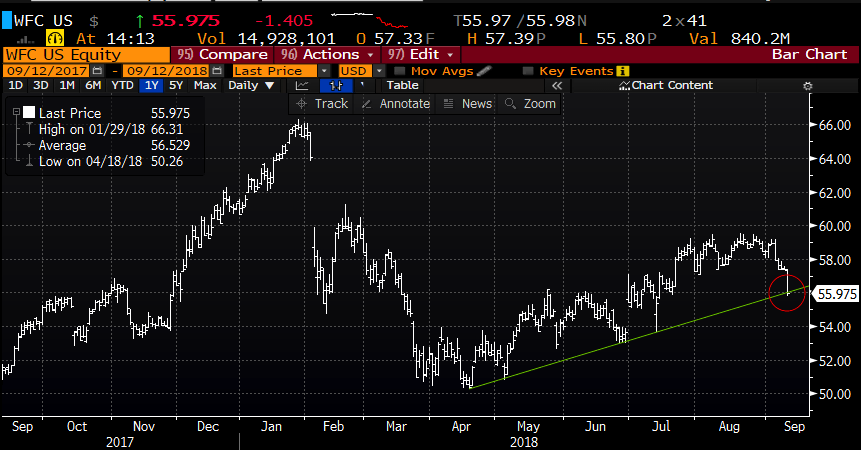
And then there is Wells Fargo (WFC) which has been mired in controversy with what seems to be a never-ending series of scandals, and just today The Office of the Comptroller of the Currency rejected WFC’s plans to compensate some consumers for their illicit activities, causing shares to decline 2.5%, bringing its ytd loses to 8%, placing the stock right on the uptrend from the 52 week lows made in April:
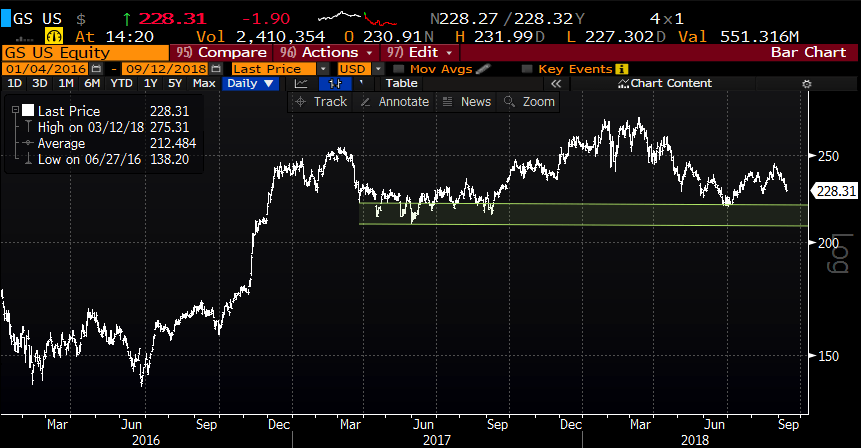
And Goldman Sachs (GS), which Bloomberg noted is engaged in its longest decline ever at 11 days, despite being a fairly narrow decline of about 7%, placing the stock down 10.5% on the year, and down 17% from its all-time highs made in March and now approaching key support at $220:
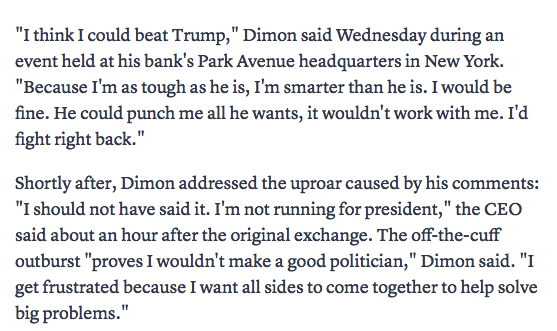
And lastly, there is JP Morgan (JPM) who’s CEO Jamie Dimon had some fairly direct commentary suggesting a potential political showdown with President Trump, via CNBC:
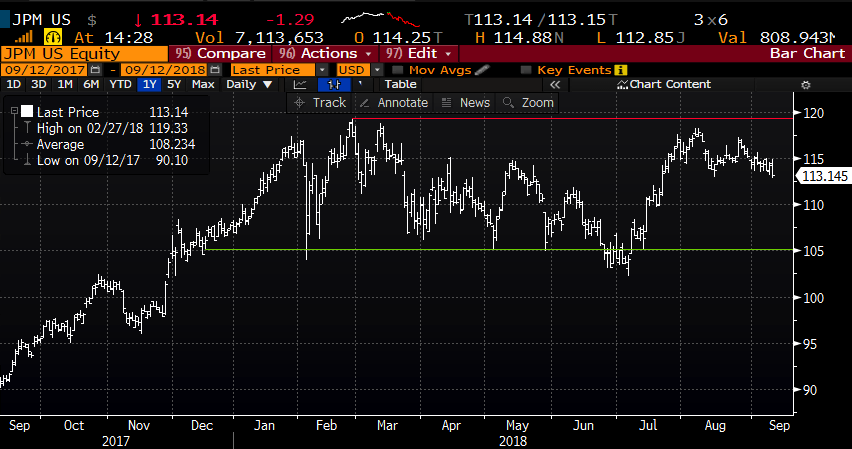
Shares of JPM up nearly 6% on the year, aside from Bank of America’s (BAC) 3% ytd gains is one of only two of the major U.S. banks stocks that is up on the year, and down only 5% from its 52-week and all-time high made in late February. I think it is safe to say this stock is in a fairly healthy consolidation… there is nothing wrong here, other than the potential re-test of the recent lows near $105:
But we might need some popcorn for what comes next between Dimon and Trump, but as Omar liked to say in the Pharmacy “You Come At the King,You Best Not Miss”.
So with a little less than three weeks left in Q3, I suspect results were softish, and given Citi’s reaction today we are not likely to see a reaction to “seasonal” results that will lift the under-performers like Citi, GS, MS and WFC.
In a month, C, JPM & WFC will get Q3 earnings kicked off on Oct 12th, followed by BAC on Oct 15th, GS on Oct 16th, and Morgan Stanley (MS) Oct 17th. These six bank stocks make up about 40% of the XLF, the etf that tracks the sector, with a few more reporting the week after.
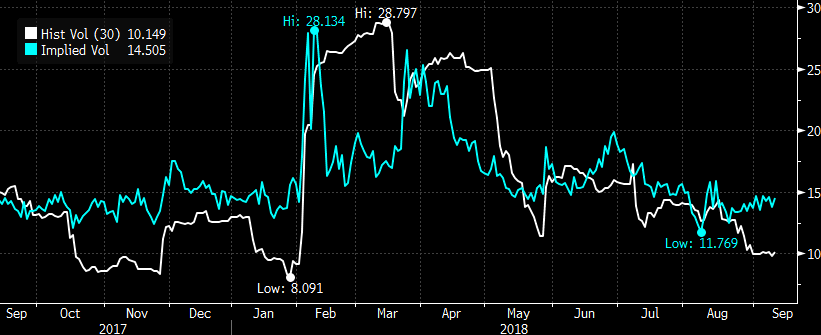
Looking at short-dated options prices in the XLF, 30 day at the money implied volatility has risen from its August lows of about 12% (blue line below) to 14.5%, still well below the 2018 highs from January at about 28%, but more in line with the one year average of about 16%. This while 30 day at the money realized volatility (white line below) is at just 10%, this spread is fairly wide, obviously incorporating potential vol for earnings season. Options prices seem fair to possibly cheap over the next month:
So what’s the trade? On the Dimon/Trump front… is this going to turn the administration’s ire on banks, a sector that Trump clearly targeted during the 2016 presidential campaign? If so this could suppress the sector near term.
From purely a technical standpoint to my eye a break below $28 should see a re-test back towards $27, a support level often tested throughout the year…
Trade Idea: XLF ($28.10) Buy Oct 26th weekly expiration 28/ 26.50 put spread for 35 cents
-Buy to open 1 Oct 26th weekly 28 put for 55 cents
-Sell to open 1 Oct 26th weekly 26.50 put at 20 cents
Break-even on Oct 26th weekly expiration:
Profits of up to $1.15 between 27.65 and 26.50 with max gain of $1.15 at 26.50 or lower.
Loses of up to 35 cents between 27.65 and 28 with max loss of 35 cents at 28 or higher
Rationale: this trade ides risks 1.25% of the stock price over the next 6 weeks to possibly make 3x the premium at risk if the stock is down 5.5% over that time period that will capture most of its components Q3 earnings. Low-risk reasonable reward trade idea.