On this past Friday’s Options Action on CNBC, my co-panelist and technician extraordinaire Carter Worth of Cornerstone Research made a bullish case for oil stocks watch below:
The case is, they look so bad that made they could be good for a bounce… Specifically, he is suggesting that the OIH, the Oil Service etf, which Schlumberger (SLB) and Haliburton (HAL) have too dramatically underperformed integrated oil names that make up the XLE, the S&P energy etf where Exxon (XOM) and Chevron make up almost 39% of its weight. Carter is not making a table-pounding call, merely what he calls a throw-back to the very well defined downtrend, near $25:
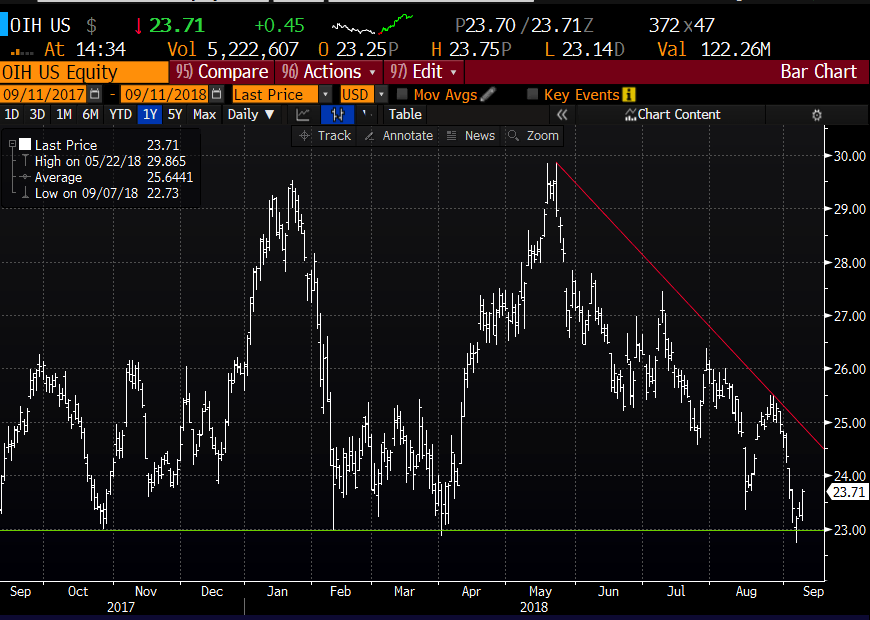
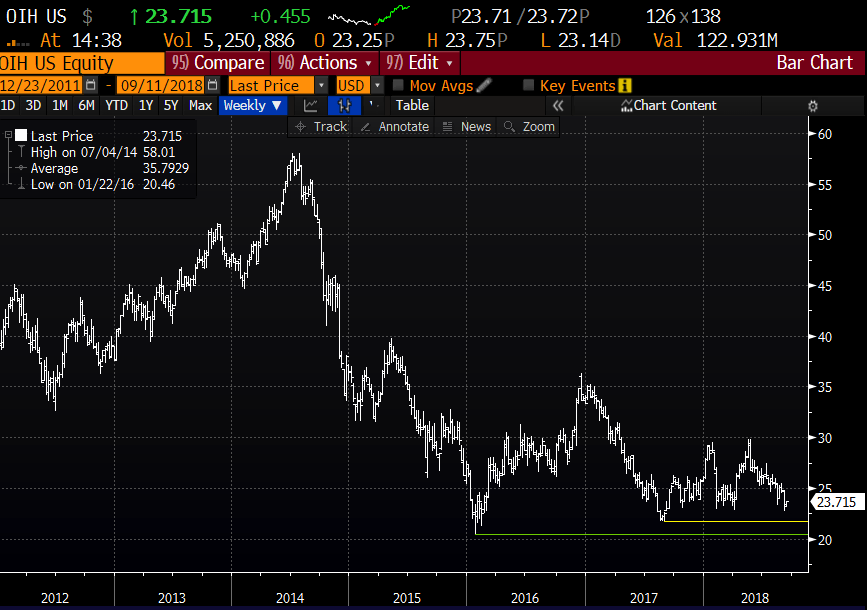
It’s abundantly clear from the chart above that $23 is an important support level over the last year and a break below that puts the 2017 low near $22 and the all-time low made in 2016 near $20 very much in play:
My other panelist, the Professor, Mike Khouw detailed a bullish near-term trade idea using options where the goal was to minimize the premium paid for the strategy. The trade Mike chose a call spread risk reversal, selling a downside put and using the proceeds to help finance the purchase of an upside call spread… here was the trade idea from Friday:
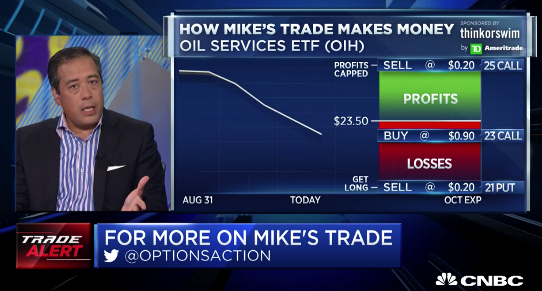
OIH ($23.20) Buy Oct 21 / 23-25 call spread risk reversal for 50 cents
-Sell to open 1 Oct 21 put at 20 cents
-Buy to open 1 Oct 23 call for 90 cents
-Sell to open 1 Oct 25 call at 20 cents
Break-even on Oct expiration:
Profits of up to 1.50 between 23.50 and 25 with max gain above 25
Losses of up to 50 cents between 23 and 23,50, losses of 50 cents below 23 with the worst case scenario the stock is 21 or lower and you are put 100 shares per 1 put contract short and suffer losses below 21 plus the 50 cents premium paid for the trade.
So my take was fairly clear from the video, I just don’t like selling such a dollar cheap put in a group that has gap risk like Oil. Mike did highlight the fact that because it is an etf it does not have the idiosyncratic risk of a single stock. When Mike sold the Oct 21 put at 20 cents on Friday it had about a 15 delta, or about a 15% probability of being in the money on Oct expiration, which is right on the border of probabilities that are smart to sell. All that being said, if Mike had just bought the Oct 23-25 call spread for 70 cents, which was already 20 cents in the money he would be risking more but actually has a higher probability of losing more money than had he not sold the downside put. And this is the constant back and forth options traders who are picking directions of the underlying have to deal with, In general, I would rather take out the worst case scenario by selling cheap options and have to make decisions on defined risk trades that are long premium. But like anything in trading, it comes down to how convicted you are with any one idea and how well you size positions and determine how much you are willing to lose to express a view.
How would I be contrarian in the OIH?? If I were looking to make a defend risk play for a bounce I might get a bit more optimistic and actually play for a breakout above the downtrend, rather than just a near-term snap back to it… while also extending the time for such an occurance to take place, for instance I might consider buying the OIH ($23.80) Jan19 24 / 28 call spread for $1 which breaks-even at 25 and offers gains of up to $3 between 25 and 28. but again, its all a matter of probabilities, risk-reward and conviction.
AND—-> One more thing, if OIH fails below the downtrend and there are fundamental reasons for oil drillers to underperform, watch out below, because as I said on Fast Money and here on Twitter to my friend, Pete, SLB, the largest component of the OIH at 20% is one of the worst looking charts I have ever seen, and epic head and shoulders top.. it better hold $60:
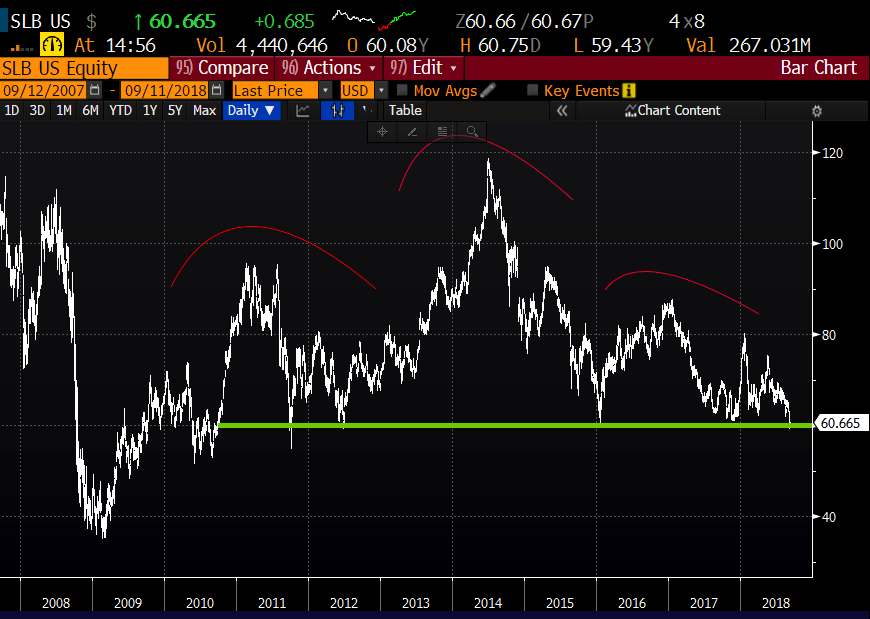
@CNBCFastMoney fans are you buying @petenajarian ‘s $SLB??
One of the worst looking charts in the entire market. pic.twitter.com/zSfcBdPOEC— Dan Nathan (@RiskReversal) August 22, 2018