Back in mid-May, we detailed a bearish strategy in the etf that tracks emerging market stocks, EEM (Emerging Volatility?) addressing commentary from the WSJ on the on the impact of rising U.S. rates for emerging markets:
The fear of contagion is stalking emerging markets again, but Argentina and Turkey have put themselves in the firing line while others have distanced themselves from it.
The shakeout in emerging markets sparked by the “taper tantrum” of 2013 put the spotlight on countries with relatively wide current-account deficits. The turmoil that has hit some vulnerable countries as U.S. rates have risen again has started with similar weak links, but times have changed: there are fewer immediately obvious follow-on targets.
Over the past couple of weeks, trade tensions turning into currency wars have dominated the economic news with China, as has the collapse of Turkey’s Lira and the potential for contagion to European and emerging market banks, These are not new themes of the last few years, and the fears seemed to be contained to China and Turkey’s risk asset prices, but there seems to be a similar smell of complacency in the air… and smells like the scent of Fortress America.
With the S&P 500 just 1% from its prior all-time made in late January, investors in U.S. stocks don’t seem particularly concerned, despite the fact that the Shanghai Composite’s 22% declines since late January, and the EEM’s 18% loss during the same period.
Some might see the SPX’s consolidation in 2018 as healthy, a bout of volatility from the January highs, followed by a series of higher lows and higher highs, in striking distance from a breakout that could result in an eventual melt-up in prices to above 3000 by year-end:
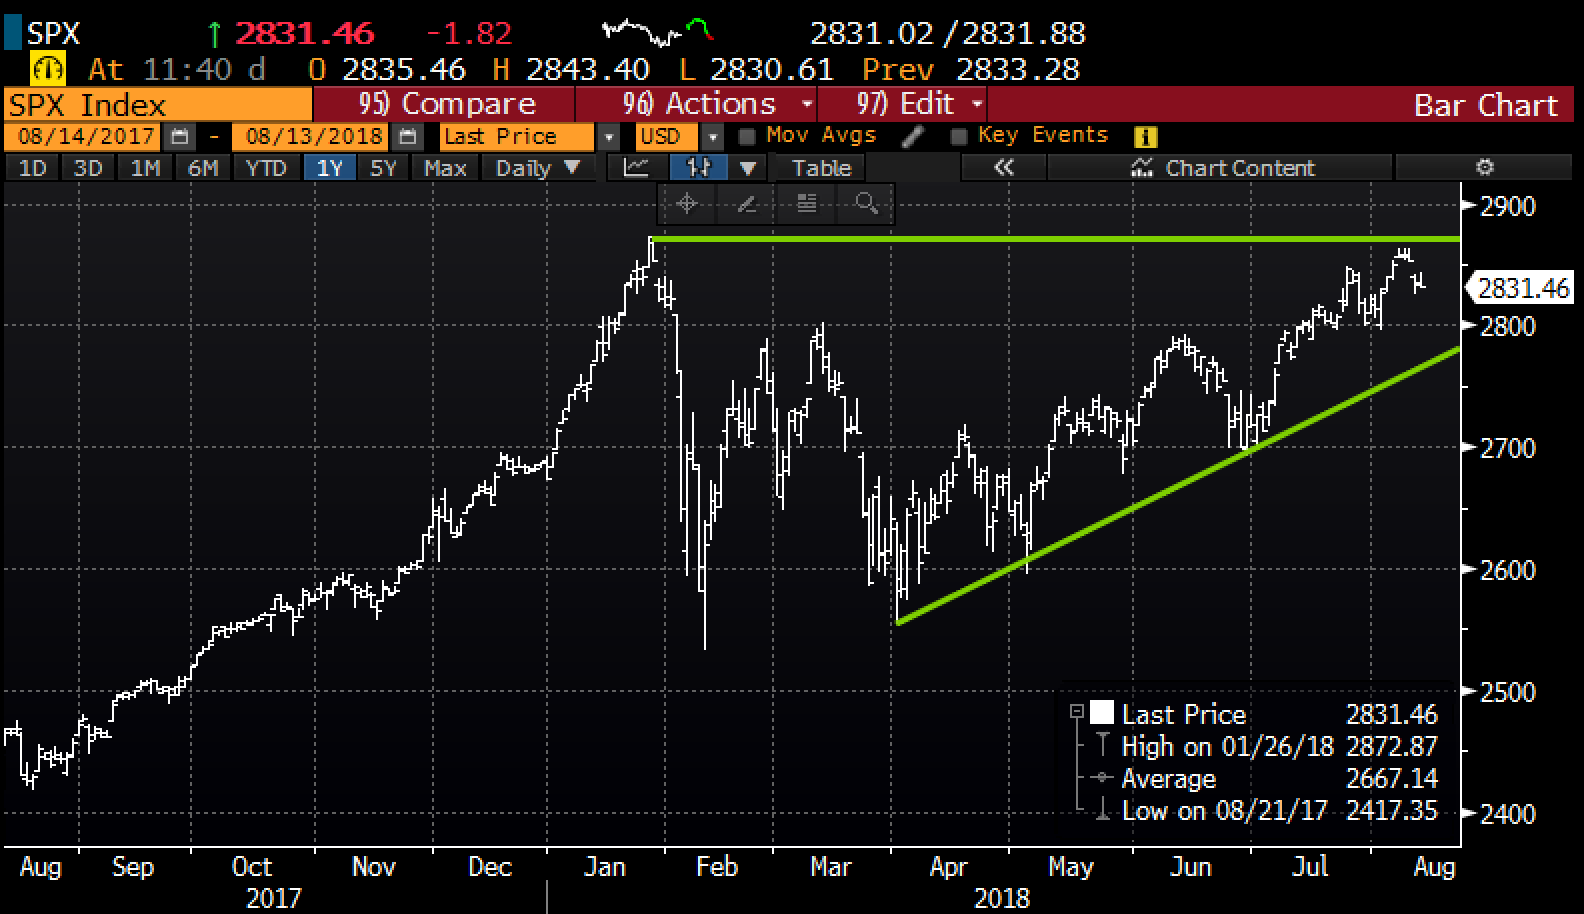
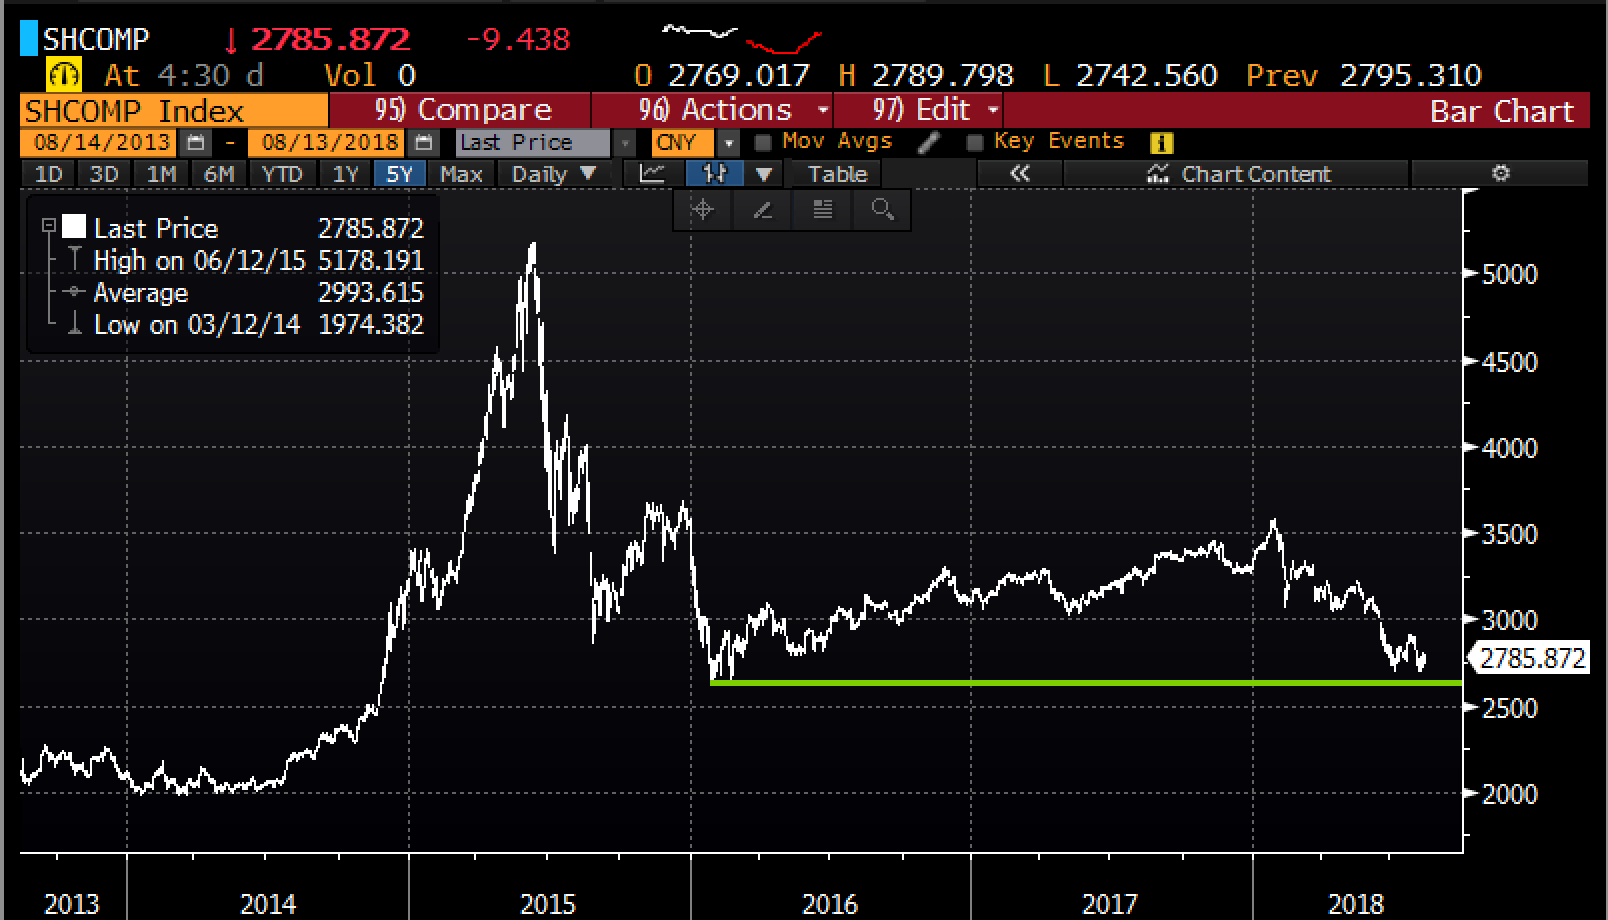
But I am hard-pressed to think that at some point in the near future that a breakdown in the Shanghai Composite would not cause global stock markets to correct:
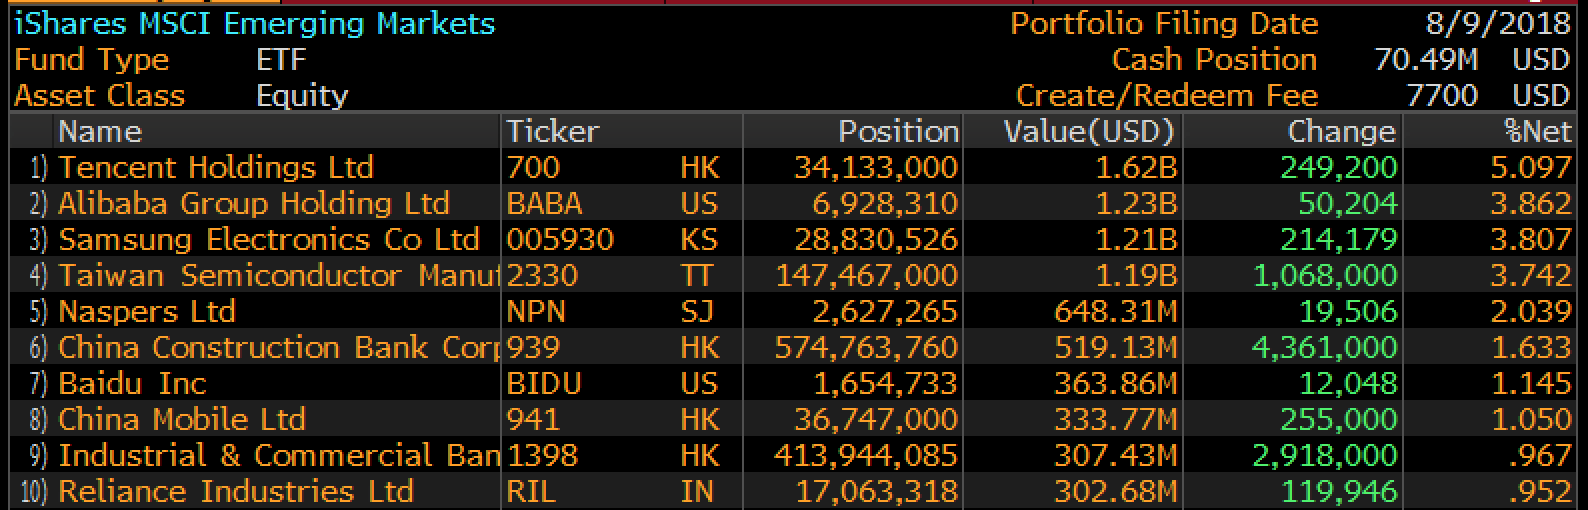
Which brings me back to the EEM, whose ten largest holdings are predominantly dependant on China’s economy, with most in correction territory, with the worst performing South Korea’s Samsung which is down 21% from its 2018 highs.
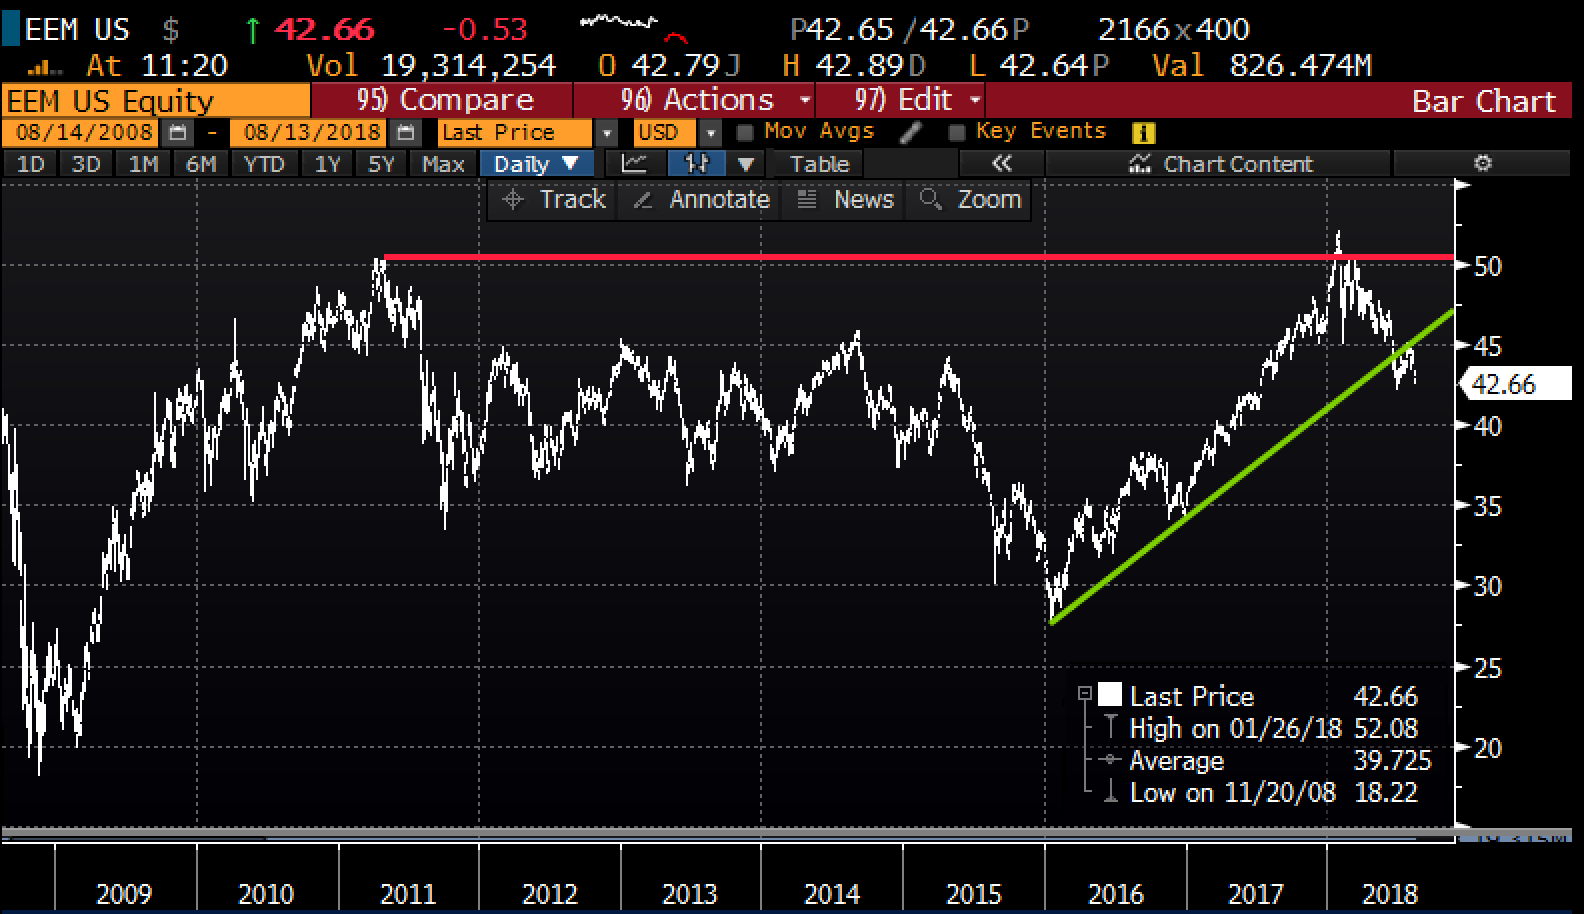
EEM’s 10-year chart is notable as at the start of the year many technicians were highlighting what appeared to be a breakout to new 10-year highs. But I suspect those same technicians now see that failure as an epic double top, with the etf over the last couple months breaking the uptrend from the 2016 lows:
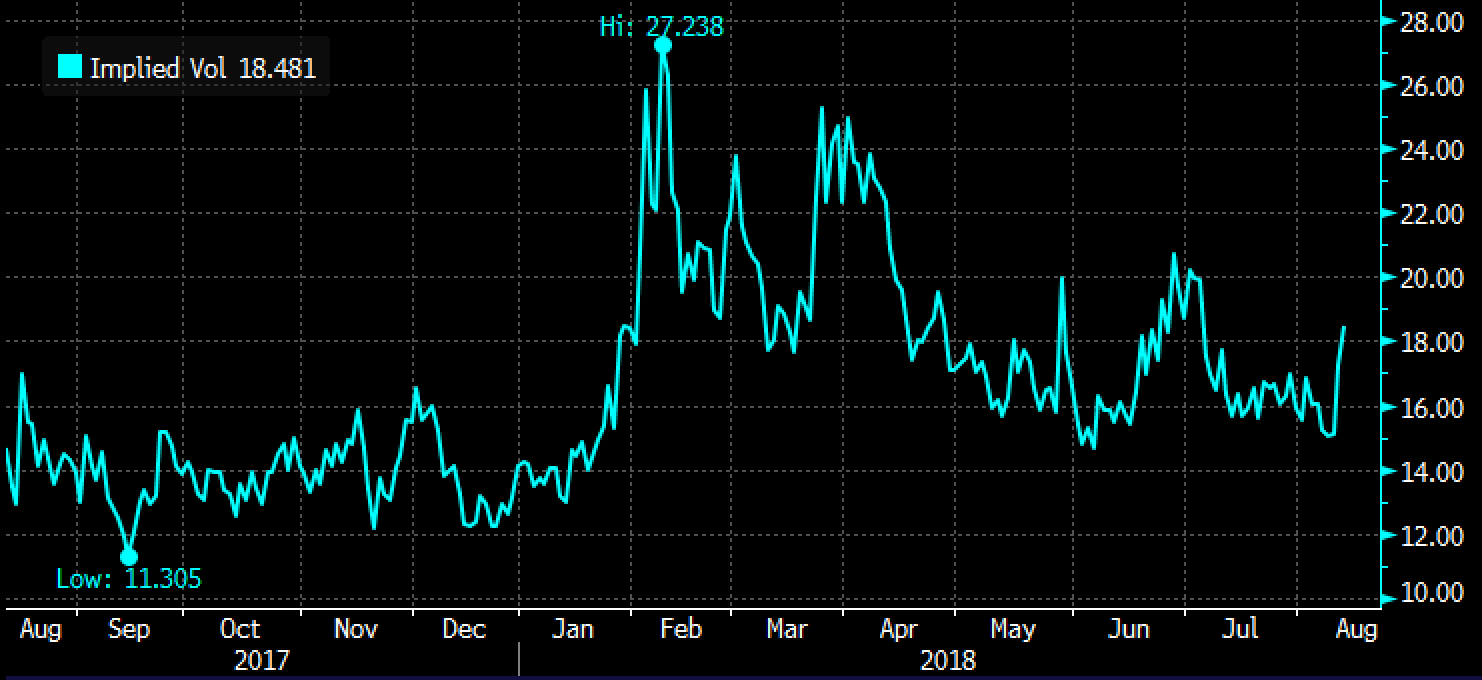
What’s fairly clear from the chart below of 30-day at the money implied volatility, the price of EEM options, is that since the highs in January, short-dated options prices have remained elevated to 2017 when the etf was in rally mode, but still fairly low relative to the sustained period of volatility in the first half of 2018:
So what’s the trade? If I were inclined to play for lower lows in the EEM over the next couple months, thought options prices were cheap relative to its recent past and wanted to have exposure over the next couple months I might consider the following defined risk trade idea:
Trade Idea: EEM ($42.50) Buy Oct 42.50 / 38 put spread for $1
-Buy to open 1 Oct 42.50 put for 1.30
-Sell to open 1 Oct 38 put at 30 cents
Break-even on Oct expiration:
Profits of up to 3.50 between 41.50 and 38 with a max gain of 3.50 at 38 or lower.
Losses of up to 1 between 41,50 and 42.50 with max loss of 1 at 42.50 or higher
Rationale: This trade idea risks 2.4% of the stock price playing for a continued breakdown over the next two months offering a profit potential of 3.5x the premium at risk, which would be equal to more than 8% of the etf price if it were down 10%.