This morning Caterpillar (CAT) announced better than expected fq2 results and raised full-year 2018 guidance suggesting that strong demand would offset headwinds from tariffs, per CNBC.com:
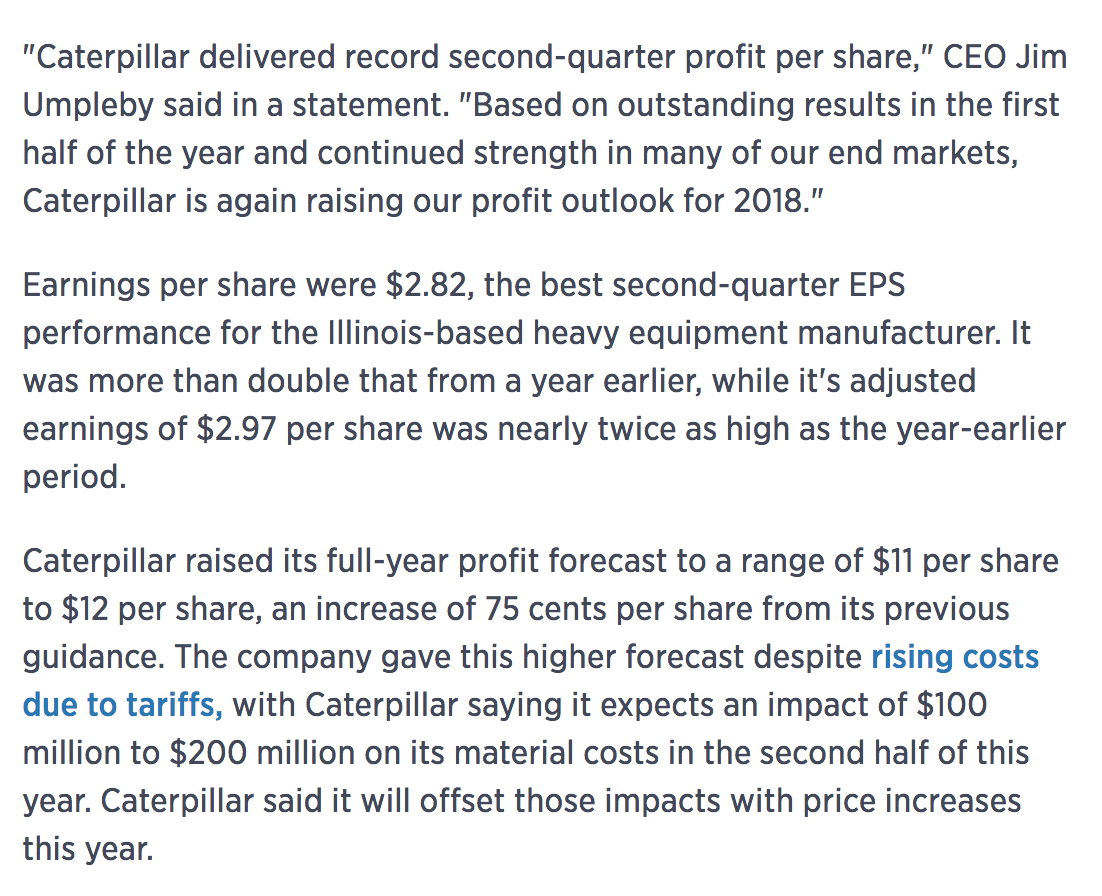
As one would expect, the stock opened up a few percent, but has since given back those gains and has been straddling the even mark for the session. This is significant because this is a company widely viewed to be a beneficiary of the synchronized global growth theme that has permeated investor sentiment for the better part of the last year, despite the fact that the stock is down 9% on the year, and nearly 18% from its all-time highs made in January. Since gapping to new all-time highs last July, after a very long base, the stock went nearly parabolic gaining 50% in the January highs. $140 appears to be an important support/resistance level, while the downtrend near $150 seems a tad insurmountable at the moment given that good news on top of poor sentiment could not get the stock moving.
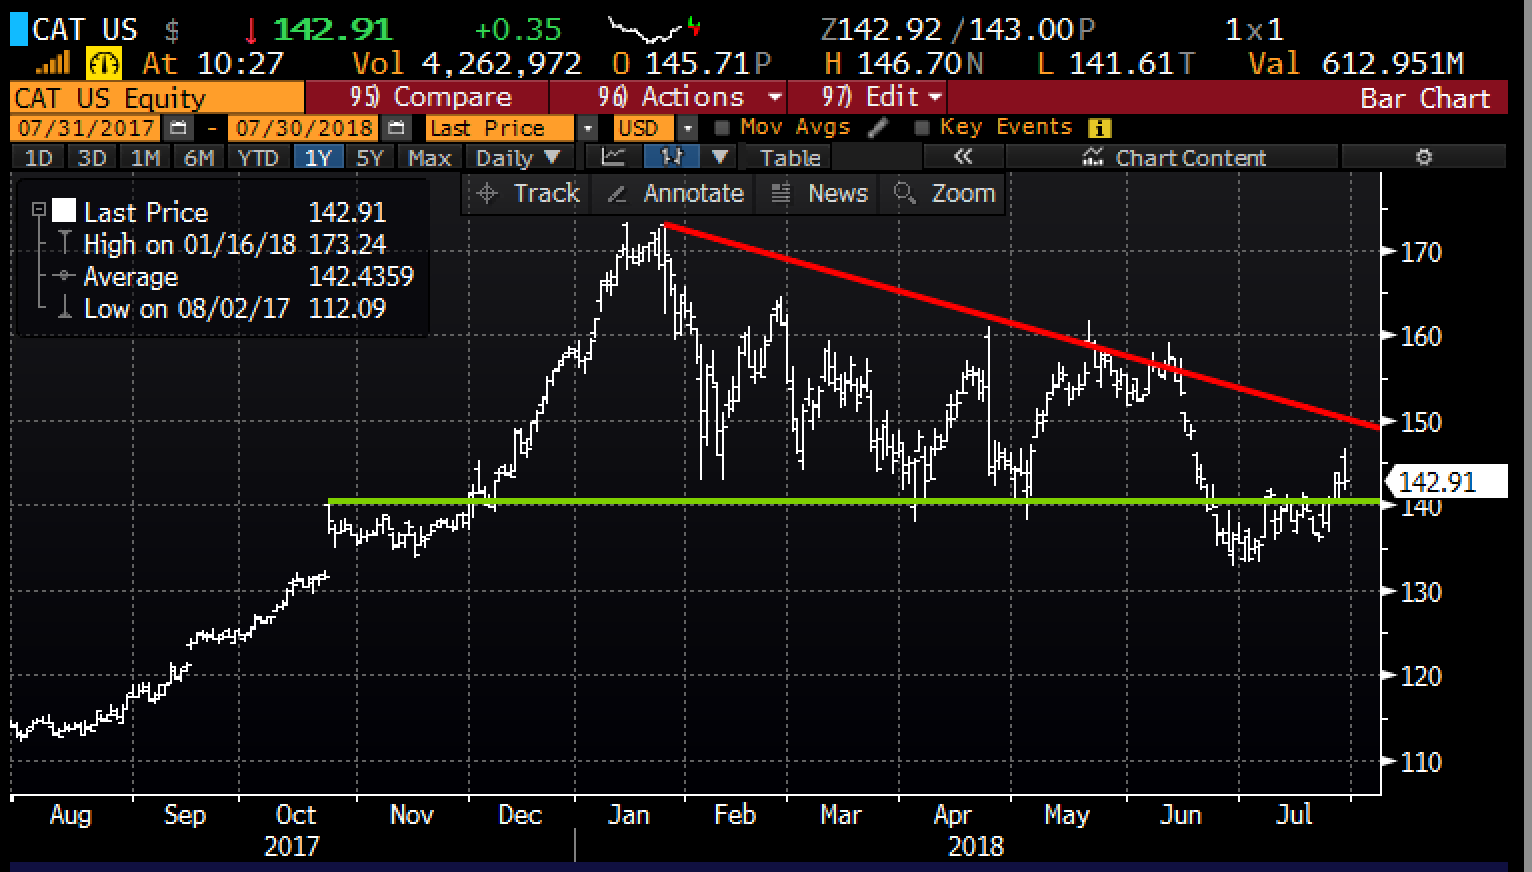
Looking at the five-year chart, what is fairly evident is the air pocket between the $140 support level and last summer’s breakout level to new highs near $115, which given the series of lower highs and lower lows since the January highs, a gap fill is looking more and more likely (IMO):
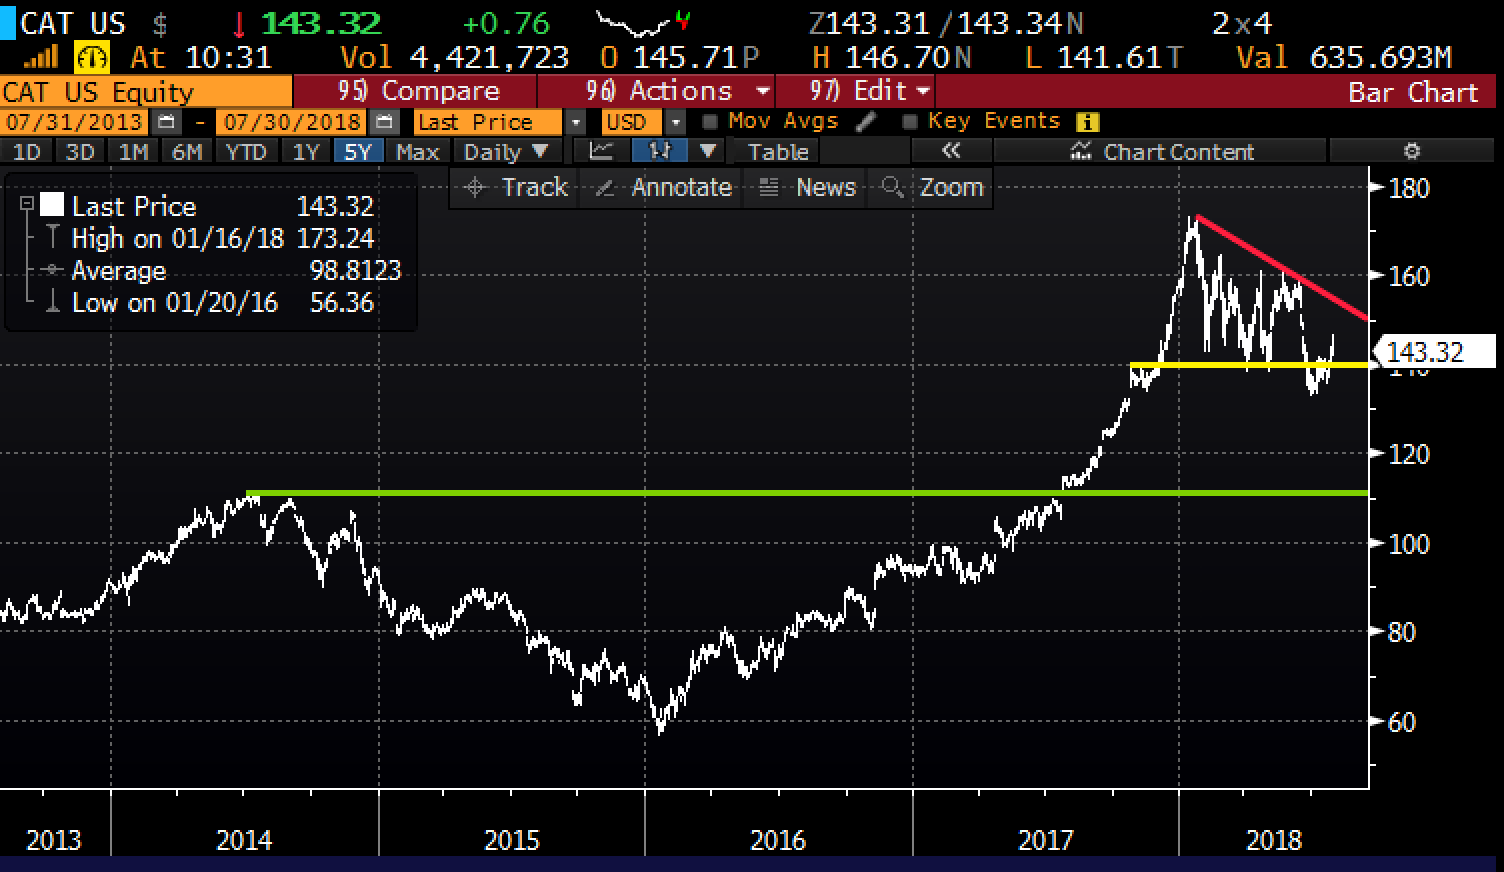
Short-dated options prices have been elevated for a few reasons, the poor sentiment, poor price action, rising U.S. dollar (55% of their sales come from outside North America), and the sensitivity to global growth and the uncertainty around a brewing global trade-war has caused investor and analyst trepidation. But there is one other reason why options prices appear expensive, the stock has been volatile, especially relative to a low vol market of late that has been for months inching back towards the January highs. The chart below shows 30-day at the money implied volatility (blue line, the price of options) vs 30-day at the money realized volatility (white line, how much the stock has been moving). Whats interesting here is that they are both very near one another if the stock were to gather some steam to the downside, short-dated options prices, while relatively high is basically in line with the one year average:
So what’s the trade? The market has a similar sort of feel to the way we headed in August 2018 where U.S. interest rate policy (the course and pace of rate increases) was of particular investor focus, as was China’s Central Bank’s support of their currency vs the U.S. Dollar, now with the backdrop of a trade war with China. U.S. exporters could be the whipping boys until there is a resolution, which I would not expect to see with too much time prior to the mid-terms as the Chinese know they have leverage.
If you are inclined to play for a breakdown below $140 and a possible gap fill in the next 8 weeks with defined risk, consider the following bearish trade idea:
CAT ($144) Buy Sept 140 / 120 / 100 Put Butterfly for $3
-Buy to open 1 Sept 140 put for 3.80
-Sell to open 2 Sept 120 puts at 45 cents each or 90 cents total
-Buy to open 1 Sept 100 put for 10 cents
Break-Even on Sept expiration:
Profits of up to 17 between 137 and 103 with max gain of 17 at 120
Loses of up to 3 between 100 and 103 & between 137 and 140 with max loss of 3 below 100 or above 140
Rationale; this trade idea risks 2% of the stock price playing for a breakdown below key support offering a wide range of profitability to the downside of more than 5 to 1.