As I am perusing some of the names scheduled to report earnings next week I like to screen for stocks where the options market is expecting large moves in either direction,. But I also like to zip through the charts and see where some of these stocks have been of late, how do they act relative to the market, their peer group etc to get a sense for sentiment into the print.
The chart of Haliburton (HAL) stuck out to me given the stock’s volatility so far this year, finding some technical support in the mid $40s, a level that had served as technical resistance:
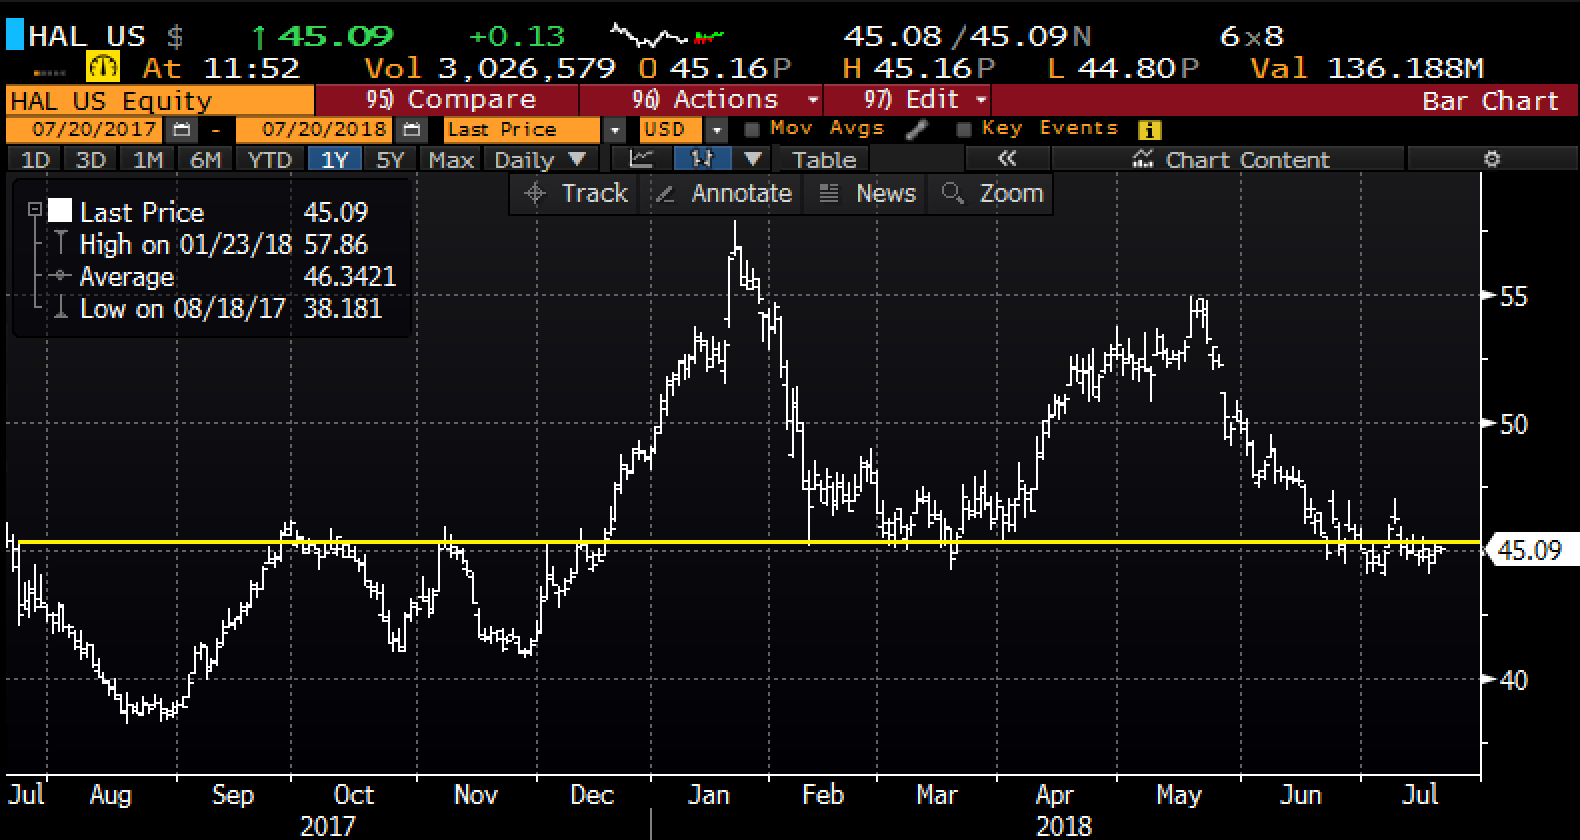
The company is set to report Q2 results prior to the market open on Monday. The options market is implying about a $1.80 move in either direction or about 4%, which is above its long-term one-day post earnings average move of about 3%.
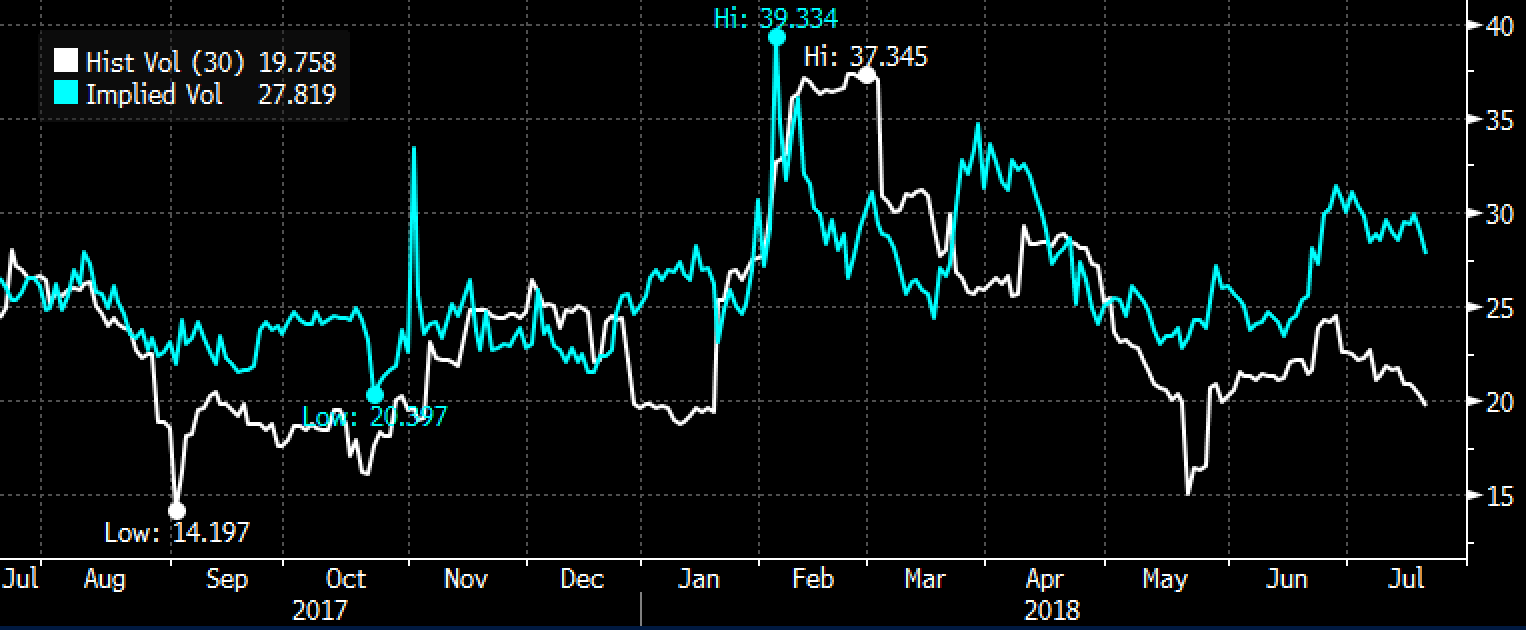
The spread between realized volatility (white line below, how much the stock is moving) vs implied volatility (blue line below, the price of options) is quite white, signaling what we already know, is that options prices are expensive into the print, and make it quite challenged for short-dated long premium directional trades:
If I were inclined to play for a bounce back to resistance at $50, or a decline to support at $40 I would consider butterflies.
Bullish: HAL ($45.10) Buy Aug 45 / 50 / 55 call butterfly for $1
-Buy 1 Aug 45 call for 1.45
-Sell 2 Aug 50 calls at 25 cents each or 50 cents total
-Buy 1 Aug 55 call at for 5 cents
Break-even on Aug expiration:
Profits of up to 4 between 46 and 54 with max gain of 4 at 50
Losses of up to 1 between 45 & 46 and between 54 & 55 wth a max loss of 1 below 45 and above 55
Rationale, this trade risks about 2% of the stock price to make a defined risk bullish bet to possibly make up to 9% with a massive range to the upside.
OR
Bearish: HAL ($45.10) Buy Aug 45 / 40 put spread for $1.15
-Buy 1 Aug 45 put for 1.30
-Sell 1 Aug 40 put at 15 cents
Break-even on Aug expiration:
Profits of up to 3.85 between 43.85 and 40 with max gain of 3.85 at 40 or lower.
Losses of up to 1.15 between 43.85 and 45 with a max loss of 1.15 above 45
Rationale, this trade risks about 2.5% of the stock price to make a defined risk bearish bet to possibly make up to close to 9% if the stock were to gap and continue lower over the next month.