American Express (AXP) will report their Q2 results tonight after the close, the options market is implying about a 3% move in either direction tomorrow, which is rich to its 2.25% average one day move over the last four quarters, but well below the 7.5% rally the stock experienced after its Q1 print in mid-April to a new all-time high.
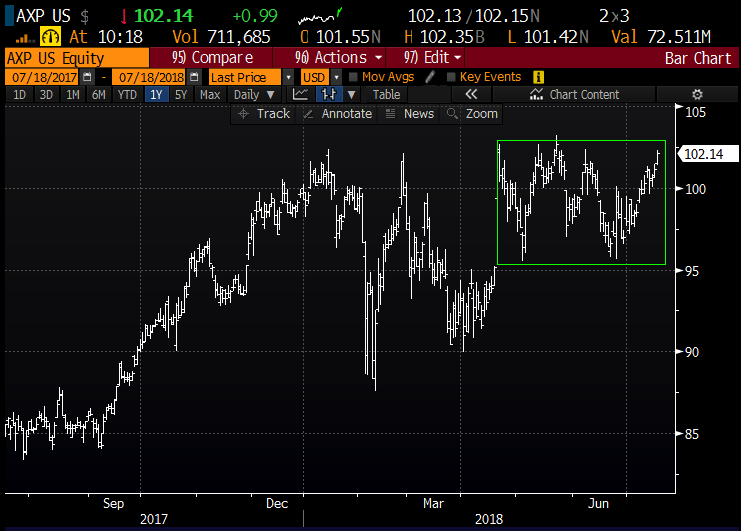
Shares of AXP up 3% on the year have mildly underperformed the S&P 500 (SPX) which is up 5% ytd, consolidating since its Q1 print, between $95 on the downside and $103 on the upside, forming what might be a nice base setting the stage for a breakout on better than expected guidance:
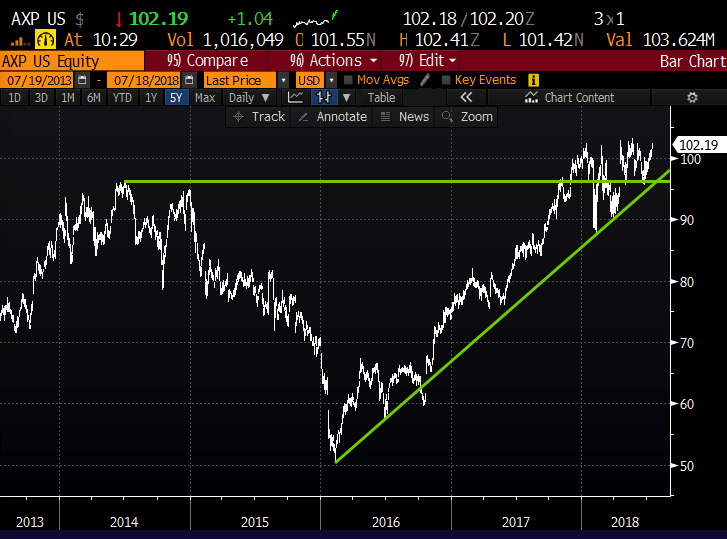
Taking a look at the five-year chart of AXP, what’s clear is that the Q1 gap above $100 capped a 100% rise from its early 2016 lows, and the consolidation above $95 is important because it is above the prior all-time highs from 2014, which also intersects with the uptrend, representing key technical support:
Wall Street analysts remain fairly mixed on AXP, with 13 Buy ratings, 18 Holds and 2 Sells with an average 12-month price target of $109.60. This despite fairly reasonable valuation relative to its peers and the market, trading 14x expected 2018 eps growth of 23% and 13x expected 2019 eps growth of 11% on expected sales growth of 20% and 7% respectively. Obviously credit quality among consumers and small businesses is a big driver of investor sentiment.
So what’s the trade?
Beat and Raise and the stock breaks out above 2018 resistance. Miss and guide down and its back to support at $95. In-line quarter and guidance and the stock continues to consolidate. From a trading perspective, AXP historically has not been a standout as far outperforming its implied movement, making long premium directional trades losers on the way out of events. So for those with a directional inclination, it may make sense to be a little creative with options.
For instance:
Bullish trade idea: AXP ($102.50) Buy July 106 / Aug 105 call calendar for $1
-Sell to open 1 July 106 call at 50 cents
-Buy to open 1 Aug 105 call for 1.50
Break-Even on July expiration (Friday):
If the stock is below 106 the July 106 call will expire worthless, off-setting the decay in the Aug 105 call which should pick up deltas if the stock is higher than current levels.
The max risk of the trade is $1, less than 1% of the stock price, offering follow-through potential on a breakout for the next month.
Or
Bearish Trade Idea: AXP ($102.50) Buy Aug 100 / 95 / 90 Put Butterfly for 70 cents
-Buy 1 Aug 100 put for 1.56
-Sell 2 Aug 95 puts at 53 cents each, or 106 total
-Buy 1 Aug 90 put for 20 cents
Break-even on Aug expiration:
Profits of up to 4.30 between 99.30 and 90.70 with max gain of 4.30 at 95
Losses of up to 70 cents between 90 and 90.70 & between 99.30 and 100 with max loss of 70 cents below 90 and above 100
Rationale: this trade idea risks less than 1% of the stock price targeting a move in the next month back to technical support at 95.
OR
Neutral for Existing Longs – AXP Overwrite: Sell 1 Aug 105 call at $1.55 vs 100 shares of stock long at $102.50
Break-evens on Aug expiration:
Profits of the stock up to 106.55, if the stock is 105 or lower receive the 1.55 in premium, which also serves as a buffer to the downside.
Losses of the stock below 100.95.
Rationale: this overlay targets a move higher in line with the implied move adding 1% potential yield over the next month, with a call-away level up 4%.
Longs should not do a trade overlay like this if they thought there was a good chance the stock could explode to the upside as they would be capping their gains.
If the stock was above the short strike the investor could always cover the short call for a loss to keep the long position intact as opposed to letting the stock be called-away.