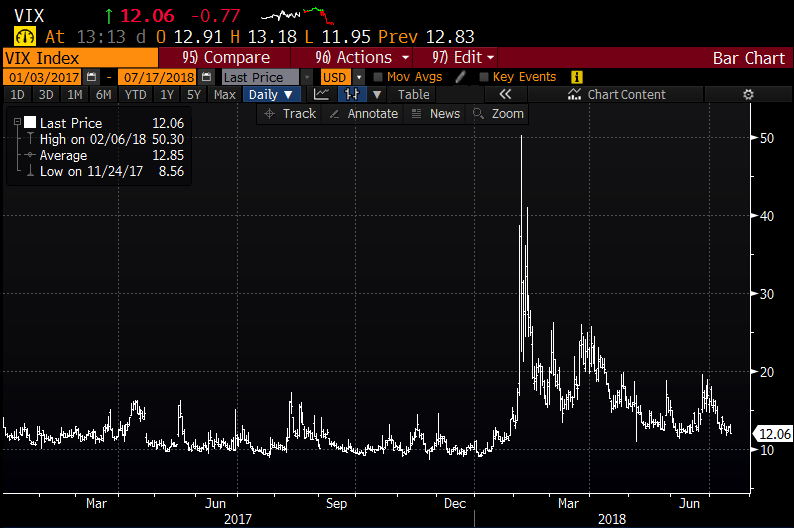
2017 was a period of unprecedented low levels of equity volatility in the U.S., a period that did not see a peak to trough decline of greater than 3% for the entire year. The VIX, the CBOE Volatility Index) which measures the volatility of the S&P 500 (SPX)) spent most the year straddling 10, with a handful of spikes to the mid-teens on shallow and short-lived sell-offs in the SPX. 2018 has been a slightly different story with one of the largest spikes in the January/February sell-off, briefly kissing 50. Since Feb there has been a series of lower lows as the SPX is now less than 3% from the January all-time highs, with obvious support near 10:
I don’t think charting products like the VIX is that useful of an endeavor because its technicals are dependent on the more reliably chart-able SPX, but for those looking to trade options on the VIX, being cognizant of those levels are important to help inform strikes on this cash settled product that has unique skew characteristics. For instance, normally downside puts are more expensive than upside calls, but in a product like the VIX which basically can’t go to zero, but could go to infinity, options skew is inverted with puts being dollar and vol cheap and calls being dollar and vol expensive. This is similar to what you’d see in a commodity whose prices “crash up” but can never actually go to zero.
Which is one reason that a popular trade for those looking to speculate on sharp rises in the VIX is to sell near the money puts and buy wide out of the money call spreads and hope to do it for no cost, setting up a sort of asymmetric payoff in the event of a vol spike.
Let’s go back to that chart that matters here, the is SPX breaking out above psychological technical resistance at 2800 and appears to be making an attempt at the prior all-time highs from Jan, near 2970, which is new resistance. As for support, 2700 was the recent bounce level, but also the intersection of the one-year uptrend. A test of 2970 and a failure there would make prior resistance at 2800 support, and then the next level 2700.
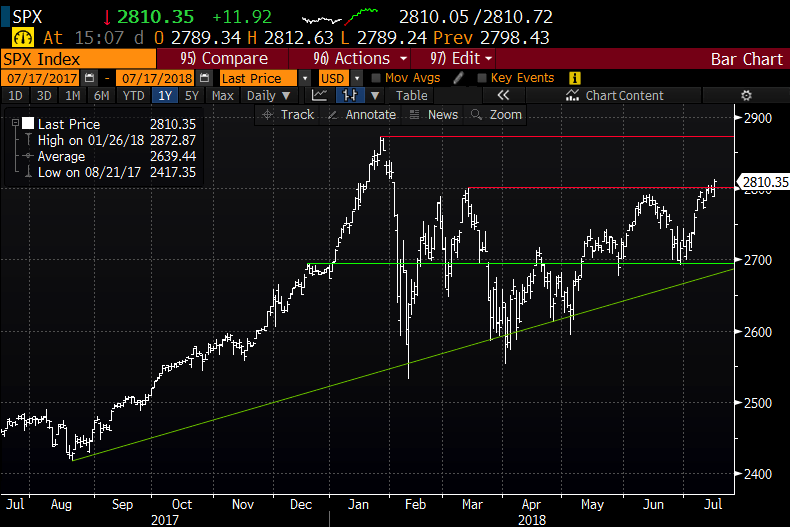
A 200 point failure from the prior highs, into the Fall with so much heating up the geopolitical front, including the midterms elections, Trade War with China, the end of QE in Europe, quickly inverting yield curve here, Mueller, etc, etc, etc and isn’t out of the realm of possibility. And with vol so low in the Summer doldrums we could have the set up for a late Summer, early Fall vol spike.
If you wanted to play that with the VIX, specifically options in the VIX you might consider the following trade idea…
Trade Idea: VIX ($12) Buy the Sept 12 put – 20/30 call spread risk reversal for .10
-Sell 1 Sept 12 put at 45 cents
-Buy 1 Sept 20 call for 1.00
-Sell 1 Sept 30 call at 45 cents
Break-Even on Sept 19th expiration: If the VIX closes between 12 and 20 on Sept expiration nothing happens and you lose .10. If the VIX is below 12 there is risk but it’s only a couple dollars as the VIX doesn’t really get significantly lower than 10, even in super low vol situations. And if the VIX spikes anytime between now and that expiration date the profits can be up to 9.90 with the VIX above 30.
Rationale – This is one of those opportunities to buy vol with limited risk and huge upside reward potential. If a vol spike happened in the near term that would be great for this trade, but the real potential here is closer to the end of the Summer where any spike over 30 could mean massive profits (or as a portfolio hedge). Just because there is only .10 cost, the risk is more, likely up to $2.00 but there will be plenty of time to take the trade off for less of a loss if a VIX below 10 looks possible. The last tidbit of information is that the VIX is cash settlement, you aren’t “assigned” VIX if it does go below the put. And if the call spread is in the money you can close it at anytime or simply take the profits after settlement.