Since the U.S. financial crisis in the late 2000s it feels like the following quote could have been read at one point in every year since 2010:
“Shares of Deutsche Bank (DB) made a new 52 week low this week, down more than 20% from its 52-week highs”
– Dan Nathan
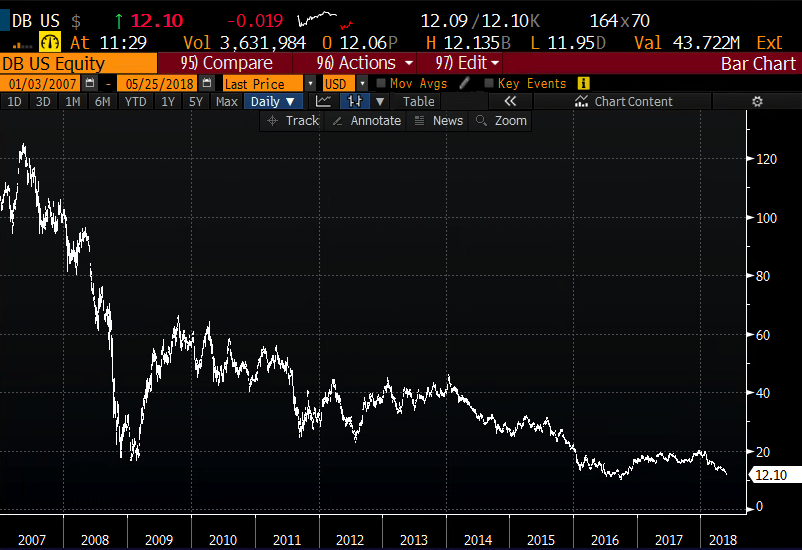
A look at the 11-year chart of DB below shows a stock that is down 90% from its pre-crisis all-time highs, below its financial crisis lows and just a couple bad headlines away from its all-time lows in 2016:
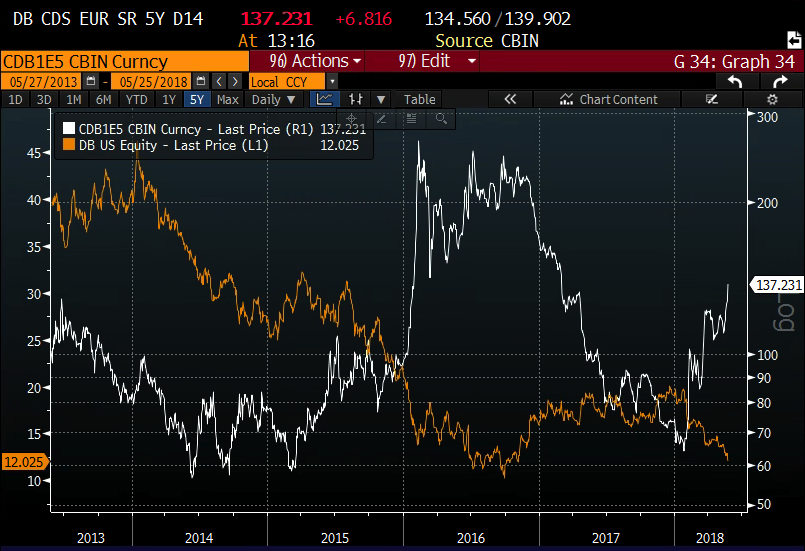
And its worth looking at DB’s equity performance and put into context the recent spike in DB’s 5yr CDS which has risen from 64 basis points to 137 basis points since January, but still well below the 265 basis points where it was when the stock was last in a free-fall in 2016 trading near current levels:
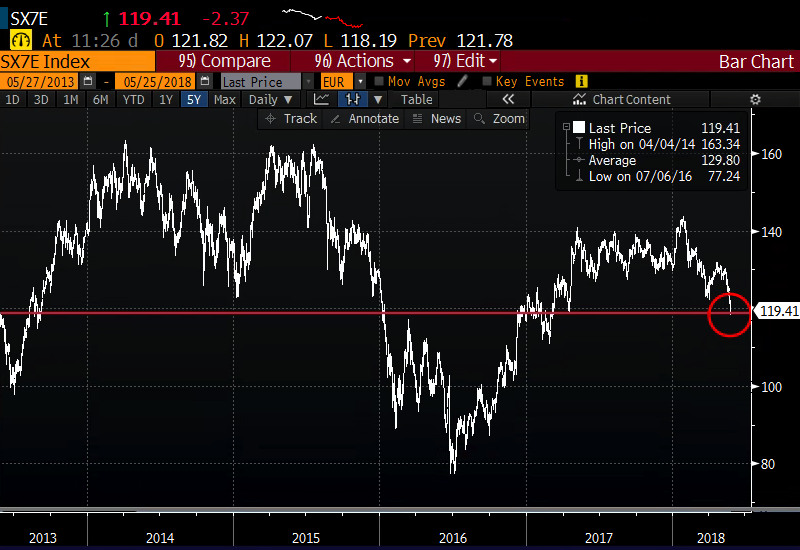
DB’s price action of late (both credit and equity) is drawing attention to the health of the European Banks which by most accounts are far further behind U.S. banks in their recovery from our and their credit crisis, with the Euro Stoxx Bank Index (SX7E) straddling 5-year support around 120:
Looking at the U.S. banking sector, which has been a bit of a mixed bag this year, a year where interest rates have had a very healthy bounce despite a little movement on the yield curve, the spread between the 2-year Treasury yield (most influenced by monetary policy) and the 10-year Treasury yield (when rising viewed as a barometer on U.S. growth and inflation) very near the lowest spread in years at 45 basis points:
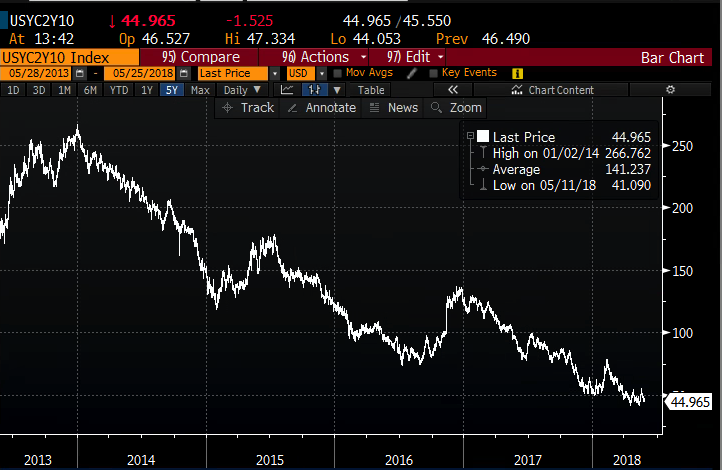
This spread is important for banks for two reasons, they borrow short term and lend long term and the difference, the net interest margin is a major determinant on their lending profitability, and obviously, U.S. banks are very levered to the health of our economy which should result in greater loan growth and supposedly wider yeild differential.
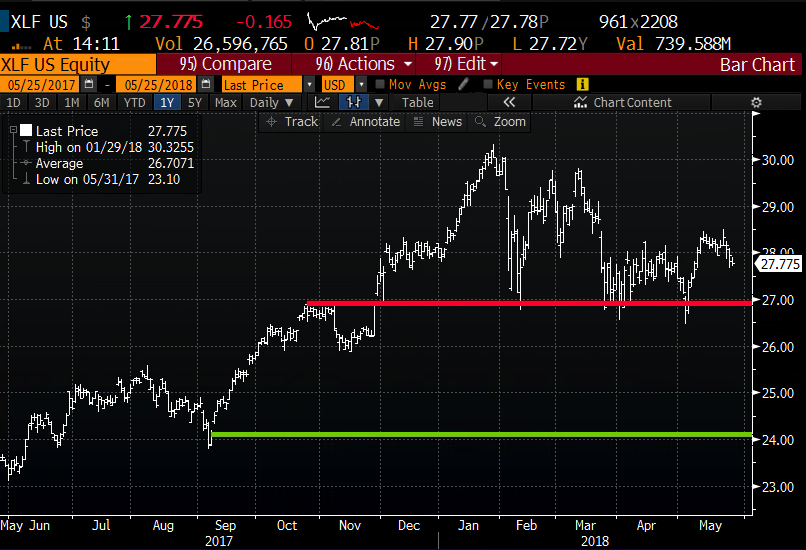
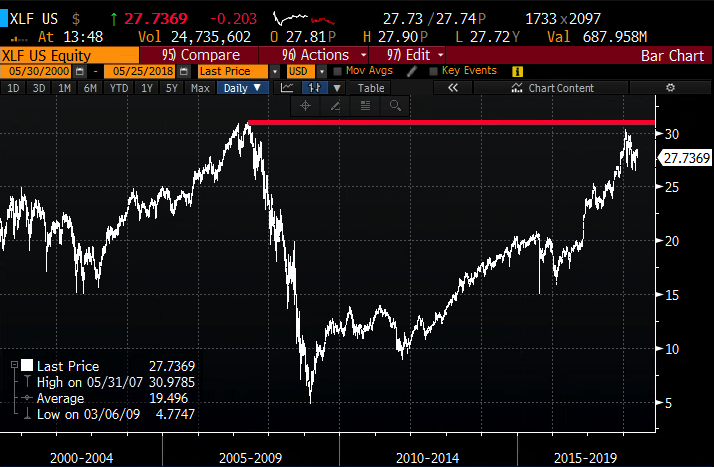
U.S. bank stocks (as measured by the XLF) are flat on the year, and down about 8.5% from their 52-week highs when the 2-10yr spread was at its widest in 2018 near 80 basis points. Interestingly, the XLF topped out just above $30 which was just below the pre-financial crisis highs:
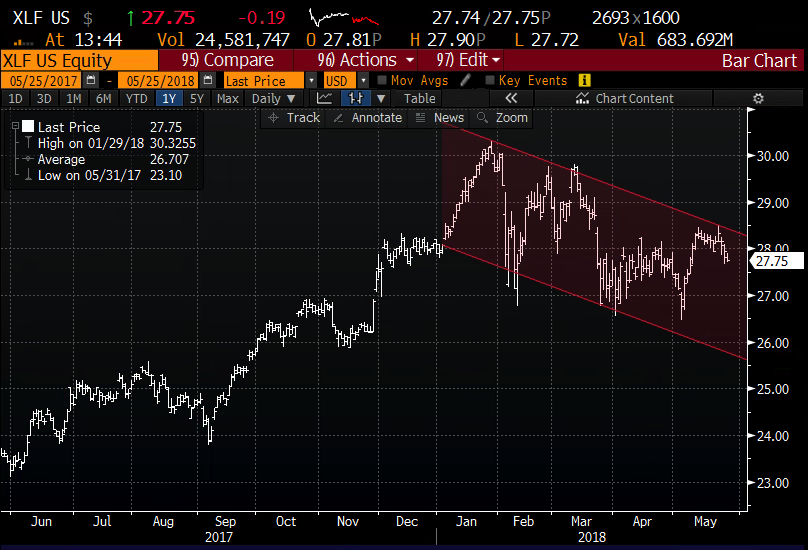
The one year chart shows the series of lower highers and lower lows from the late January highs, with the lower bound of the downtrend near $26:
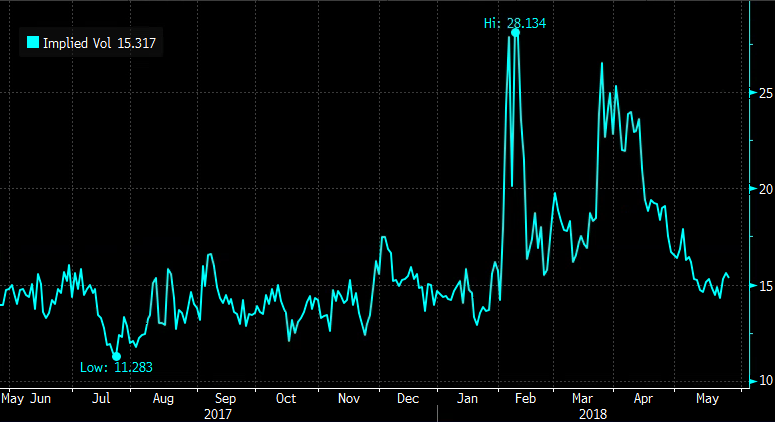
Short-dated options prices for the XLF has settled into the mid-teens in term of implied volatility, nearly half of the February highs, possibly making long premium directional options strategies attractive for those with a view:
So what’s the trade? If you think that there are troubles with DB, and that there is the potential for a spill-over to the wider Euro banking sector, and then to the U.S., then our bank stock sentiment should be impacted at a time where banks are already showing relative underperformance due to the uncertain outlook on interest rates, then you might consider the following trade idea in the XLF:
Trade Idea: XLF ($27.80) Buy Sept 28 / 24 put spread for 90 cents
-Buy to open 1 Sept 28 put for 1.13
-Sell to open 1 Sept 24 put at 23 cents
Break-even on Sept expiration:
Profits of up to 3.10 between 27.10 and 24 with the max gain of 3.10 at 24 or lower
Losses of up to 90 cents between 27.10 and 28 with the max loss of 90 cents or 3.5% if the etf is above 28
Rationale: this trade risks one to make possibly 3 if the XLF were to retrace the move since mid-September. The one-year chart below shows what this trade is targeting a break-down below 27, which is important support: