Today after the close, semiconductor equipment manufacturer Applied Materials (AMAT) will report their fiscal Q2 results. The options market is implying about a 4.5% move in either direction tomorrow (about $2.40), which is rich to the four-quarter average one-day post-earnings move of only 2.5% and the 10-year average of 3.5%.
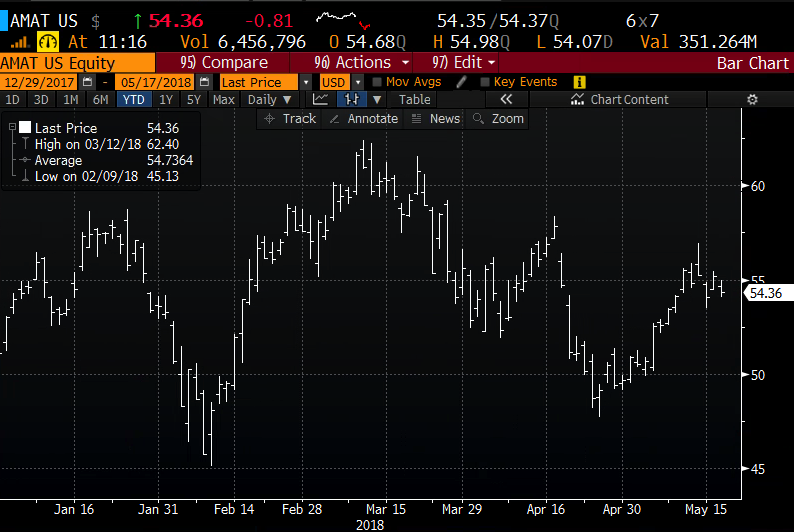
Shares of AMAT are up 6.5% on the year, outperforming the S&P 500 (SPX) but underperforming the Nasdaq’s 7.5% ytd gains and the SMH (the etf that tracks semis) 9% ytd gains. The stock has been volatile in 2018, trading as low as $45 in early February and as high as $62.40 in mid-March, making a new all-time high, but now at $54ish sits very near the midpoint of the 2018 range.
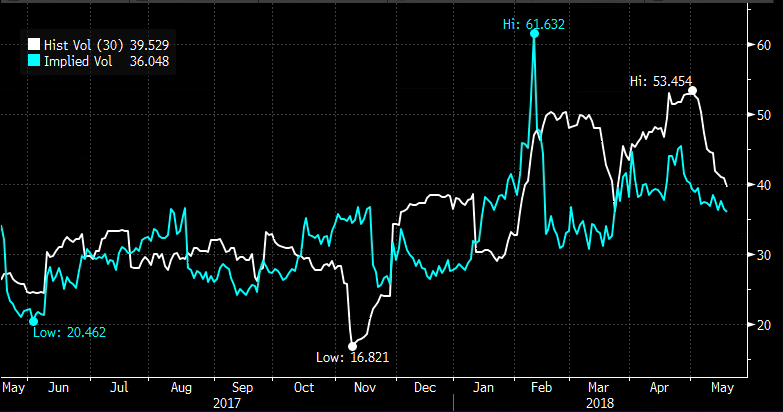
Short-dated options prices, despite being down significantly from their multi-year highs made in February, are still relatively high with 30 day at the money implied volatility (blue line below) at 36%, likely the result of 30 day-realized volatility (white line) near 40%, which is generally not a common occurrence in a $57 billion market cap company like AMAT suggesting that options prices might be fair into the print, despite looking expensive:
AMAT is a cheap stock trading 12x fiscal 2018 eps which is expected to grow 38% on 20% sales growth. This growth is expected to moderate in F2019 to about 4 & 5% respectively, one reason for the low multiple. In a earnings preview note to clients on May 6th, Credit Suisse Semi-Equipment Analyst Farhan Ahmad who rates the stock a buy with a $75 twelve month price target highlights the following points of interest from the call for investors:
Investor Focus is on Memory and Display Cycle: Commentary from memory companies implies that y/y growth in NAND/DRAM is accelerating in C2H. Investors are worried that this could lead to oversupply. We expect that investors’ concerns are unlikely to be eased until NAND y/y bit growth peaks and pricing bottoms (we expect in late C3Q). On Display – AMAT revenues are largely supported by Display investments in China (~70% of revs in CY18). Improvement in China/US trade relations could be positive; however, LT we see Display as a risk given Capex exceeds Cash Flow for the industry
As for valuation, Ahmad points to discount valuation at current levels:
The market is valuing AMAT at historic low multiples relative to the S&P. On a NTM PE basis, AMAT is trading at 11.1x, 26% below the 5 year average, and in bottom quartile of the historic trading ranges. AMAT is currently trading at 33% discount to S&P on NTM PE versus last 5 years average discount of 10%. On our estimates for CY18 EPS, AMAT is trading at 10.9x versus LRCX/KLAC/ASML at 10.5x/12.1x/27.5x.
So what’s the trade? The relative underperformance to the SMH is interesting despite not a large spread between ytd gains, AMAT is down 13% from its March highs while the SMH is down half that.
If I were inclined to play for a miss and guide down I would target $50 in the coming weeks.
Bearish Trade Idea: AMAT ($54.25) Buy May 25th weekly 54 – 50 Put Spread for $1.15
-Buy to open 1 May 25th 54 put for 1.40
-Sell to open 1 May 25th 50 put at 25 cents
Break-even on May 25th close:
Profits of up to 2.85 between 52.85 and 54 with max gain of 2.85 below 50
Losses of up to 1.15 between 52.85 and 54 with max loss of 1.15 above 54
Or if I were inclined to play for a beat and raise, targeting a one day move in line with the implied move I would consider…
Bullish Trade Idea: AMAT ($54.25) Buy May 18th (tomorrow expiration) 54.50 – 57 – 59.50 call Butterfly for 50 cents
-Buy to open 1 May 18th 54.50 call for 1.05
-Sell to open 2 May 18th 57 calls at 30 cents each or 60 total
-Buy to open 1 May 18th 59.50 call for 5 cents
Break-even on May 18th close (tomorrow):
Profits of up to 2 between 55 and 59 with max gain of 2 at 57
Losses of up to 50 cents between 54.50 and 55 & between 59.50 and 59 with max loss of 50 cents below 54.50 and above 59.50
Rationale: this is a dollar cheap way to target the implied movement to the upside offering a potential payout of 4 to 1 with defined risk.
I’ll offer our normal disclaimer for long premium directional trades into events like earnings, you need to get a lot of things right to just break-even, direction first and foremost, timing and magnitude of the move.