Macy’s (M) will report their fiscal Q1 tomorrow morning before the opening. The options market is implying about an 8.5% move in either direction post results which is a bit shy of its 10.25% average move following its last four reports but above its ten year average of about 5.5%.
Shares of Macy’s are up 16% on the year, massively outperforming the XRT, the etf that tracks the retail sector that is up 2% on the year and more than 2x the performance of the XLY, the etf that tracks the consumer discretionary space.
Looking at the one year chart, the stock has made a series of higher highs and higher lows from its November lows, which is fairly constructive coming off a very poor sentiment situation heading into the Holiday selling season:
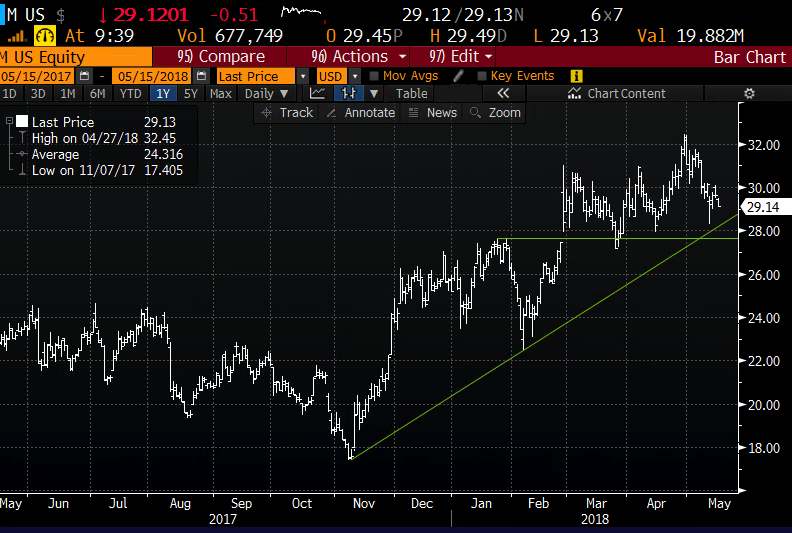
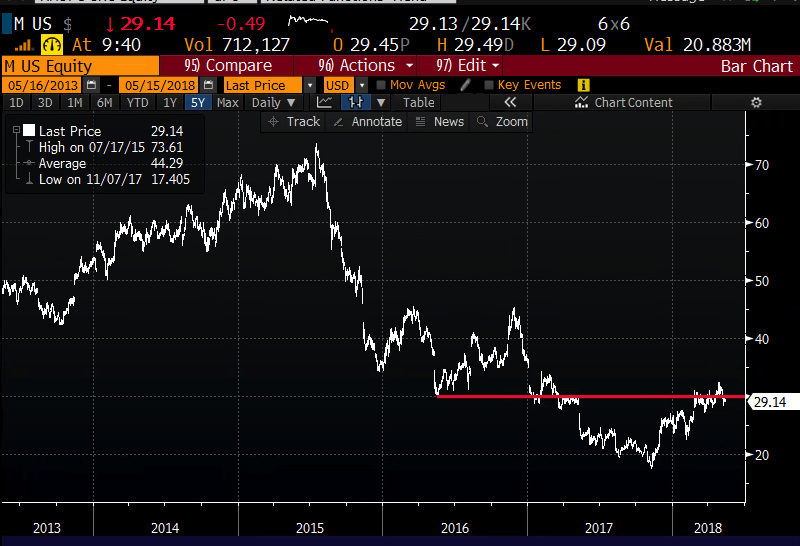
The five-year chart below shows just how dire investor sentiment got, the stock lost 75% of its value from its all-time highs made in mid-2015 to its decade-long lows made this past fall. Since the stock’s breakout above $28 in late February it has been flirting with what is a critical technical level at $30. If the stock were able to make a meaningful breakout above $30 and hold repeatedly it might end up looking like the last couple years were an epic bottoming process for the stock with little overhead resistance until $40:
Despite the stock’s ytd outperformance, Wall Street analysts remain fairly negative with only 5 Buy ratings, 11 Holds and 3 Sells with an average 12-month price target of about $30. With the stock price appreciation has come increased short interest, at multi-year highs just above 15% of the float.
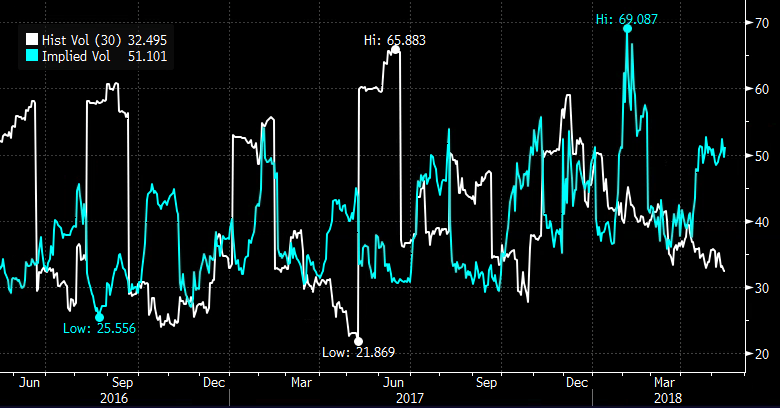
The stock’s recent consolidation between $28 and $31 has caused a relative calm in the options of the stock, with realized volatility (white line below, how much the stock is moving) at the lows of the year, while implied volatility (blue line, the price of options) at the widest spread to realized in a year making options prices appear expensive:
So what’s Macy’s got going for it right now from an investment perspective?
Frankly the narrative around Department Stores, basically that they are going the way of the dodo, does not change with a nearly 100% bounce off of decade-long lows. Sales have not been positive on a year over year basis since 2014, and this year they are only expected to be flat, while eps is expected to decline in the current fiscal year. While the company’s 5% dividend yield might be attractive, if sales and earnings were to start to decline then they will need to cut their dividend as servicing the company’s nearly $6 billion in debt $4.4b net of cash) might become a tad more challenging in a rising rate environment while their core business faces secular headwinds.
But… the bull case has more to do with Macy’s assets than its ability to ever grow sales again and compete with the likes of Amazon.com online, per NYT in Nov 2017:
What Macy’s does have going for it is real estate — a vast network of more than 600 stores across the country. Macy’s real estate, with an estimated value of $16 billion, is worth more than the company’s market value of $6.4 billion, according to an analysis by Cowen, the investment management and banking firm.
…..
The Macy’s flagship store on 34th Street is worth an estimated $3.3 billion alone. The company has no plans to sell its Manhattan flagship, a tourist magnet that contains more than one million square feet of retail space, and spent $400 million on renovating it between 2012 and 2016.
The hard part about looking at Macy’s $9 billion market cap, or $13 billion enterprise value and comparing it to expected value of their real estate holdings is that these are NOT liquid assets, this part of the story has been known for years and yet the company does not seem willing to part with the most prized locations. Activists have been involved, management has changed and still nothing.
So what’s the trade? I’ll lay out a couple ways to play for a 10% decline and one to play for a breakout above the few month range….
If I were inclined to play for a 10% decline following results I would l consider the a couple different ways to play.
If you were playing for a one day move, for a miss and guide down, then May options that expire Friday, risk 1 to maybe make 2 if the stock is down in line with the four quarter average:
Trade Idea: M ($29.45) Buy May 29 / 26 put spread for $1
-Buy to open 1 May 29 put for 1.20
-Sell to open 1 May 26 put at 20 cents
Break-Even on May expiration:
Profits of up to 2 between 28 and 26, max gain of 2 at or below 26
Losses of up to 1 between 28 and 29 with max loss of 1 above 29
Rationale: we generally are not fan of long premium trades using weekly options into events like earnings, you need to get a lot of things right to just break-even, direction, timing and magnitude of the move. This sort of trade idea is for those very convicted on a post-earnings decline. You are risking what you are willing to lose.
But… for those thinking that a decline back below the few month range may take some time… consider a Put butterfly….
Trade Idea: M ($29.45) Buy June 29 / 25 / 21 put butterfly for $1
-Buy to open 1 June 29 put for 1.80
-Sell to open 2 June 25 puts at 45 cents each or 90 cents total
-Buy to open 1 June 21 put for 10 cents
Break-Even on June expiration:
Profits of up to 3 between 28 and 22, max gain of 3 at 25
Losses of up to 1 between 28 and 29 & between 21 and 22 with max loss of 1 below 21 and above 29
Rationale: the potential payout is generally a tad below the 4 to 1 payout I would normally target using a butterfly, but given the high implied move, this structure makes sense into the earnings catalyst if considering a way to play for a large downside reaction.
Lastly… If I thought the company could post a beat and raise and the stock could rip I would consider a zero cost call spread risk reversal…
Bullish Trade Idea: M ($29.50) Sell June 27 put to Buy June 30 / 34 call spread for even
-Sell to open 1 June 27 put at 90 cents
-Buy to open 1 June 30 call for 1.45
-Sell to open 1 June 34 call at 55 cents
Break-even on June expiration:
Profits of up to 4 between 30 and 34 with max gain of 4 above 34
Losses below 27… put stock at 27
Mark to market this trade will show losses as the stock trades towards short put strike and gains as it trades to or above long call strike. Worst case scenario put 100 shares per 1 short put at or below 27 on June expiration.
Rationale: one would do this trade if they were convicted of a sharp move higher but willing to be put the stock down nearly 10% at 27.