Tiffany & Co (TIF) will report their fiscal Q4 results tomorrow before the open. The options market is implying about a 5% move in either direction or about $5. The average one-day post-earnings move over the last four quarters has been about 4.25%.
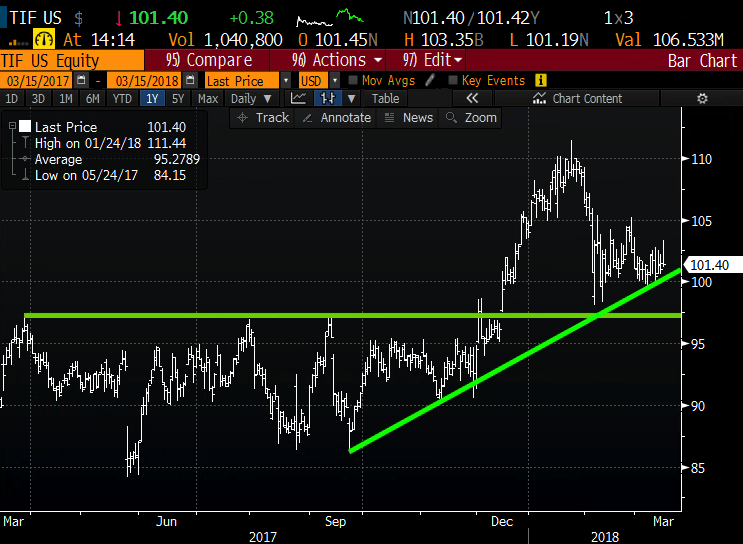
Shares of TIF are down about 2% on the year, and down about 8.5% from its 52-week and all-time highs made in late January. The one year chart below remains fairly constructive, with the recent consolidation holding the uptrend that has been in place, while the late December breakout near $98 should serve as healthy technical support:
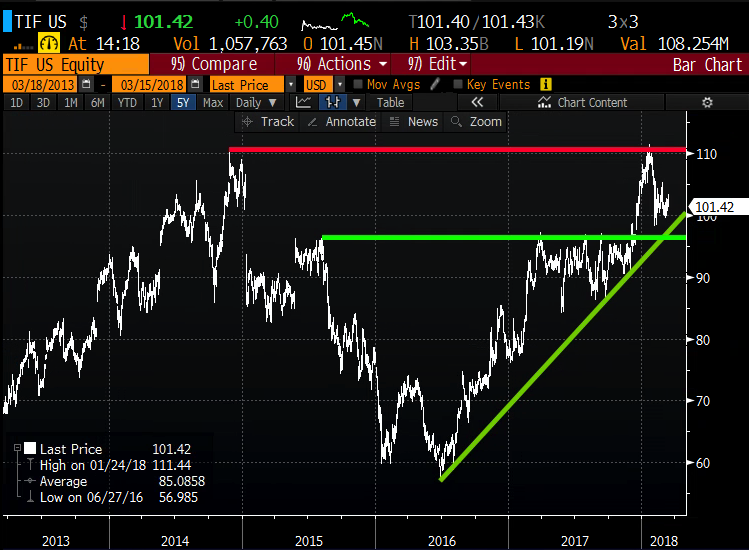
Backing the chart out a bit and the rejection at the recent highs makes a fairly massive double top, but also highlights how important near-term support is in the mid to high $90s as a break below would put the stock below the steep uptrend that has been in place since mid-2016:
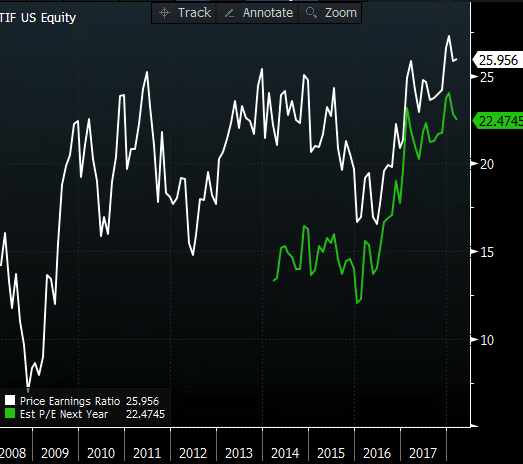
I don’t have a strong opinion on the stock be fair. Trading at 22.5x expected fiscal 2019 eps growth of 10% on 5% sales growth, very near a ten year high:
Wall Street analysts are fairly mixed ion the stock with 16 Buy ratings, 13 Holds and No Sells, with an average 12-month price target of about $111, back near the prior highs.
So what’s the trade?
If the company were to miss and guide lower the stock would likely be down in line with the implied move of about 5%. But here is the thing, options prices are not cheap for those looking to play on a directional basis. For instance targeting $95 near term, with the stock at $101.50 the April 100 / 95 put spread is 1.70, or about one-third of the width of the spread and doesn’t break-even until the stock is 98.70, down about 3%, allowing for profits of about 3.6% of the current stock price. Not a fantastic risk-reward.
So how about a put fly?
Trade Idea: TIF ($101.50) buy the April 100 / 95 / 90 put butterfly for 90 cents
-Buy 1 April 100 put for $3
-Sell 2 April 95 puts at 1.30 each or 2.60 total
-Buy 1 April 90 put for 50 cents
Break-even on April expiration:
Profits of up to 4.10 between 99.10 and 90.90 with max gain of 4.10 at 95
Losses of up to 90 cents between 90 and 90.90 & between 99.10 and 100 with max loss of 90 below 90 and above 100
On the flip side, if I were inclined to play for a move back to the prior highs just above $110, I might consider the April 100 / 110 call spread for 3.50 vs 101.50. This call spread is already 1.50 in the money, breaks-even up 2% and the in the money nature of the spread should mitigate the expected vol crush post results. Obviously, a call butterfly would work here, but the $5 wide strikes make it a tad difficult unless you are going to use weeklies.
And the problem with weeklies, regular readers will know recognize this disclaimer for long premium directional trades into events, you need to get a lot of things right to just break-even. First and foremost direction, then timing and magnitude of the move.
If you thought the stock could rally 5% tomorrow post results, vs 101.50, the March 16th weekly 102 / 107 call spread is offered at about 1.70. Not a great risk-reward, risk 1.70 to maybe make 3.30.
Here is a great example of interesting technicals, with little conviction on fundamentals, and not trading on our part…