Tomorrow before the open Target (TGT) will report their fiscal Q4 results. The options market is implying about a 5% move in either direction, which is shy of last quarter’s nearly 10% one-day post-earnings decline in mid-November, and a tad light of its average over the last four quarters of about 6.5%.
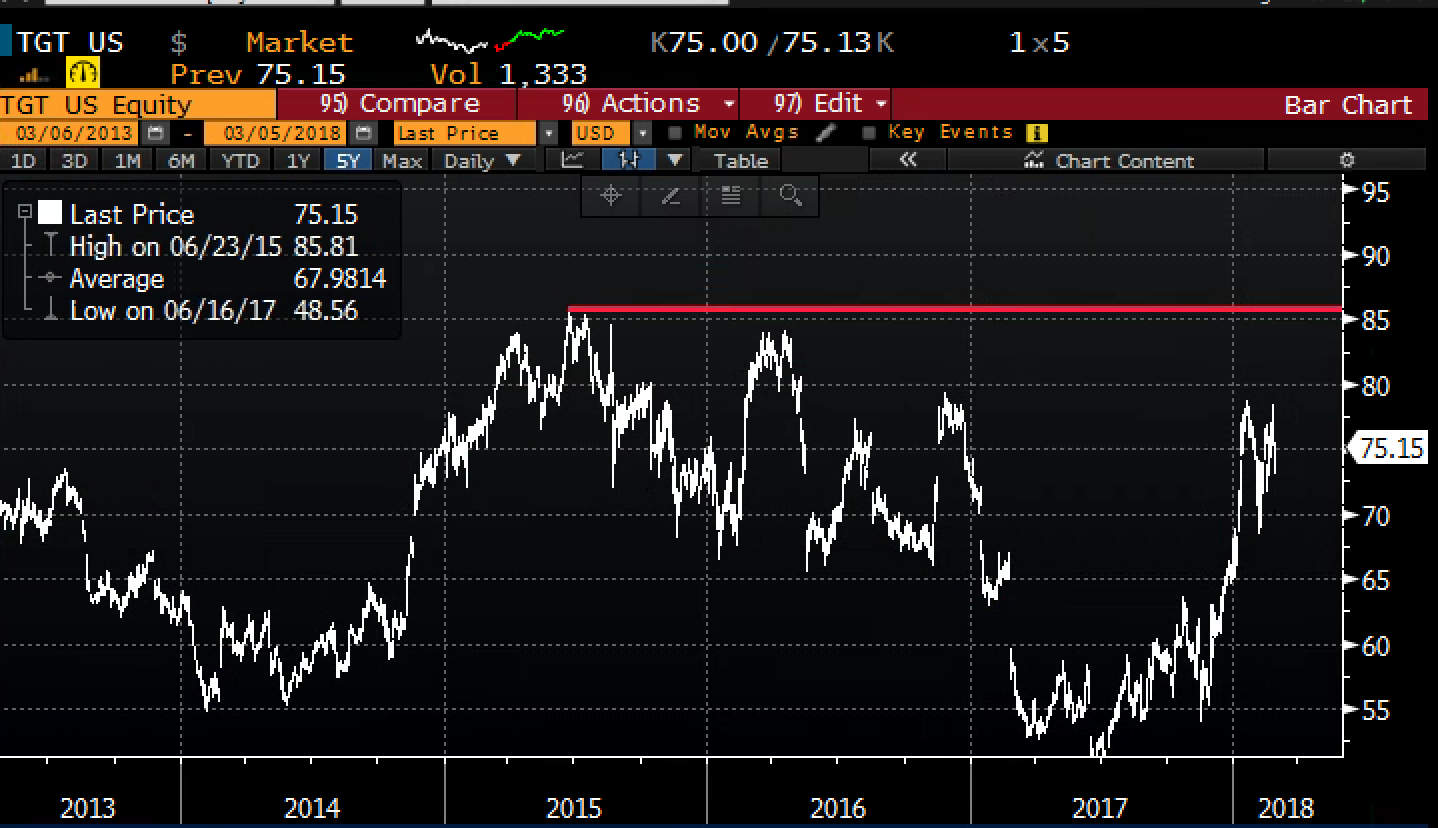
Since its last earnings gap lower, shares of TGT have been on a tear rallying nearly 40% and while not exactly in striking distance of its prior all-time high made in 2015 just above $85, the stock has broken the downtrend for the time being:
The stock trades below a market multiple at just about 14.5x expected fiscal 2019 eps growth of about 11% on only 1% sales growth, a considerable discount to Walmart (WMT) trading about 18x expected fiscal 2019 eps growth of 12% on a merely 1% sales increase.
As we consider the set up into tomorrow’s results it makes sense to go back and look what exactly tripped up the stock for a short while after their fQ3 results, what has driven the epic rally and what has caused WMT’s sharp decline since its earnings last month.
First, Q3 the company guided down for the all-important holiday quarter, but per Barron’s it sounds like MKM’s retail analyst Patrick McKeever has it right urging investors to be patient:
arguing that this latest earnings report is an early sign that Target’s investments are paying off.
The stock’s drop likely reflects disappointment with 4Q17 guidance (Street had gotten ahead of management) and concerns about cost pressures from investments in labor and store remodels, which appear to have overshadowed a better-than-expected third quarter and a modest increase in FY17 EPS guidance. While we are lowering our FY18 EPS estimate to reflect higher expenses, including higher D&A associated with a stepped-up store remodel program, we think we are being conservative and see upside potential on an improving traffic trend and strong early response to a number of new brands, mostly in the higher-margin apparel and home areas.
Walmart, on the other hand, had enjoyed very healthy gains in 2017 and for the start of 2018 until its earnings and guidance in mid-February and is now down 20% from its all-time highs made in January. Why the fall from grace? Failing to meet high expectations about online sales growth, per WSJ:
Walmart Chief Executive Doug McMillon said that as holiday goods like TVs and toys flooded Walmart’s e-commerce warehouses, they squeezed the room for everyday items such as toilet paper. That meant the retailer ran out of some items, hurting online sales. “Our in-stock for basic items suffered as a result,” Mr. McMillon said.
Walmart also said its U.S. profit margins were hit by lower prices and by more sales shifting to the web. Online sales are generally less profitable than those in stores.
The retailer’s shares had skyrocketed this year, boosted by high expectations for its online growth. On Tuesday, Walmart reported a 2.6% gain in overall sales for the quarter ended Jan. 31, for its 14th consecutive quarter of growth. But its U.S. online sales grew only 23% in the quarter, in contrast with three previous quarters of more than 50% growth.
TGT Vs. WMT: Credit Suisse’s retail analyst recently initiated TGT with an Buy rating, favoring it to WMT which he rates a Hold, per Barron’s:
Sigman’s bullish thesis on Target rests on Target’s “aggressive strategic” changes in 2017, that should result in stronger near-term sales and set it up as a retail survivor. He sees Target benefiting from a stronger consumer and market share gains, and, well, it’s just gotten too cheap. His blue-sky scenario price target for the shares is $98.
By contrast, he writes that Walmart’s premium valuation, along with its increasing investments, make it less attractive. Yes, Walmart’s spending money to position itself as a real competitor to , and that’s a necessary step that should yield fruit. However, given that the stock has had such a big run already—it’s up 28% during the past year despite last week’s big drop—he writes that investors should wait for relative sales and online growth to reaccelerate, as well as visibility into operating profit improvement, before buying.
So what’s the trade?
If I were long TGT I might consider hedges into the print that allow for some further upside but offer a certain amount of near-term downside protection, given WMT’s negative reaction after such a strong run.
Hedge for a long position
VS 100 Shares of TGT Long at $75.20 sell 1 March16th 80 calls to Buy 1 March16th 72.50 /67.50 put spread for a net a debit of .40
- Sell to open 1 March 80 call at 0.65
- Buy to open 1 March 72.50 put for 1.50
- Sell to open 1 March 67.50 put at 0.45
Break-even on March 16th expiration: Gains and losses in the stock between 72.50 and 80 (less the .40 debit). Protection of up to $5 (less the .40 debit) between 72.50 and 67.50. Called away in the stock above 80 but the hedge can be closed above that with only profits at risk.
Rationale – This low cost hedge is most likely to lose .40. But if the stock were to get hit, it protects up to $5 fairly close to the current price. For those looking for even more protection the lower strike can be adjusted to the 65s, adding another 2.50 in protection for about .25 additional cost. The 80 call sale is potentially a little tight but this hedge assumes some asymmetrical risk to the downside for long holders and if the stock were to go higher through the 80 strike there are worse problems to have than making another $5 in the stock and having to buy back the hedge at a loss.
—–
And for those looking to take a long position, again, there is some risk to the downside into the event so defining that risk makes sense:
Stock Alternative/Bullish
TGT ($75.20) Buy the March9th 75/80/90 call fly for 1.40
- Buy 1 March9th 75 call for 2.35
- Sell 2 March 80 calls at .50 (1.00 total)
- Buy 1 March 85 call for .05
Breakeven on Friday – Gains of up to 3.60 between 76.40 and 83.60 with max gain at 80. Losses of up to 1.40 below 76.40 with max loss below 75. Profits trail off above 80 and max loss again if the stock is above 85 (unlikely).
Rationale – This trade has a breakeven higher than the current stock price but it defines risk to just 1.40, way below the expected move. If the stock goes higher it defines a wide profitable range and max gain happens at 80.