On January 26th, when the S&P 500 (SPX) was trading at its all-time highs, the index was at its furthest point from its 200 day moving average than at any other point in the last 5 years, which means that the rally was getting a tad vertical, and thus extended. Which if we want to apply some simple laws of physics, it means simply that the higher it went the harder it was likely to fall. At its lows Friday, prior to the late day rally, the SPX was down nearly 12% from its Jan 26th peak, and just happened to catch a bid at its 200 day moving average which some technicians see as a natural level of support:
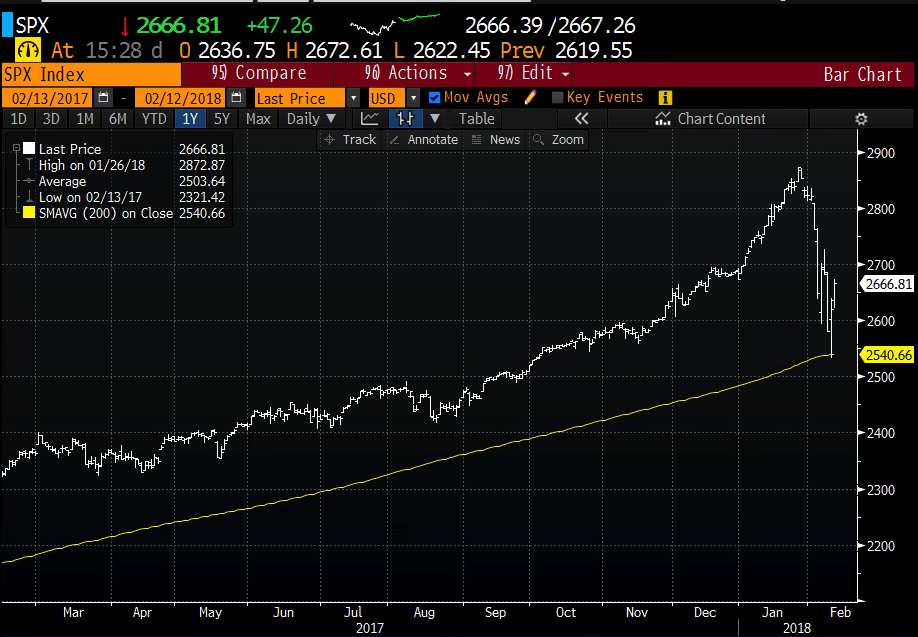
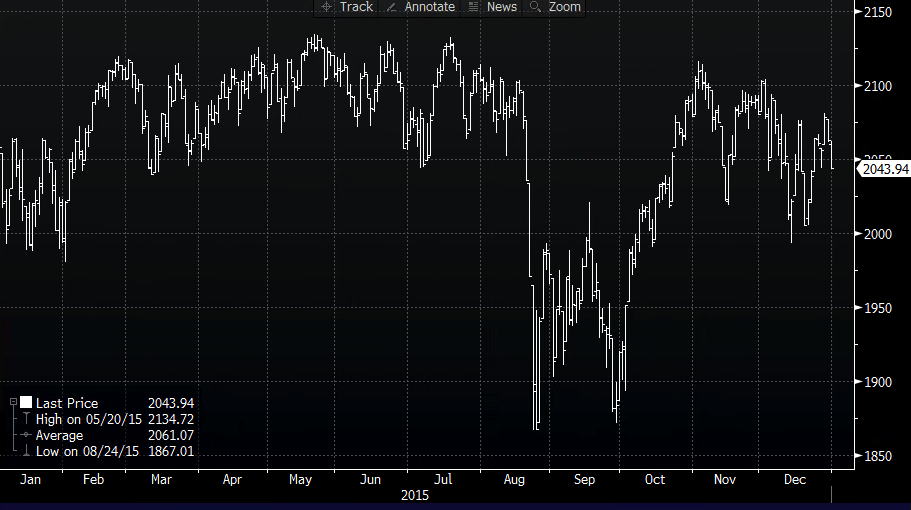
The weakness of the last two weeks broke a historically long period of lowe volatility where the SPX had not had a peak to trough decline of 3% in more than 400 days, a feat that had been accomplished last in 1928! While the 5% bounce off of Friday’s intra-day low was nothing short of impressive, playing for new highs anytime soon might be a fools errand if history is any guide. The last period where we experienced such severe downward volatility was in August/September 2015 and January/February 2016. In both instances, the SPX had a precipitous 10% drop, a sharp reversal, only to attempt a retest of the prior months low before finding its footing, here was the 2015 selloff:
And here was Q1 2016:
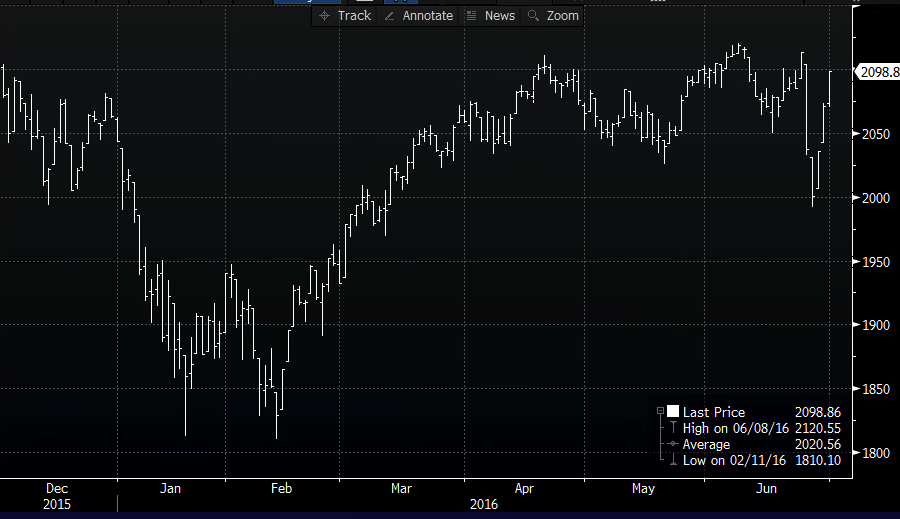
These were not classic V reversals, they were W’s, which merely means that after the sharp declines and the initial snapbacks, it took investors a little time to figure out what their next move would be.
Its also important to note that short-dated options prices in the generally cheap SPX options remained elevated during the periods detailed above:
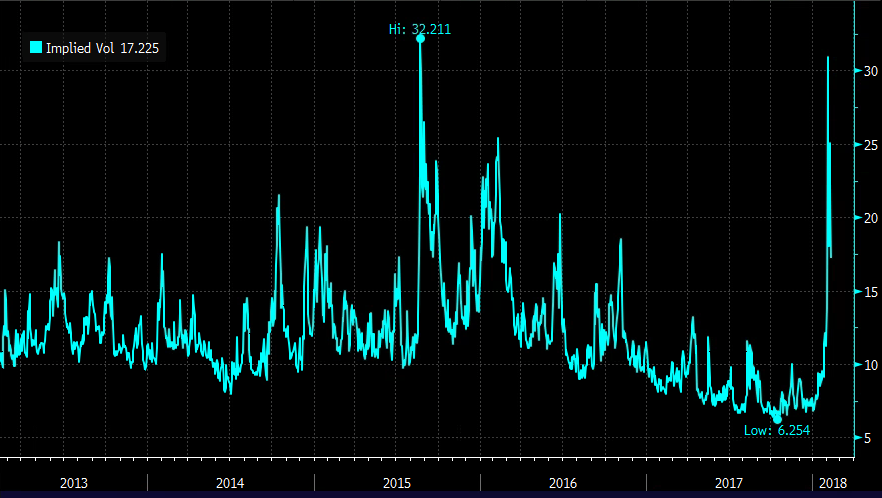
30 day at the money implied volatility in the SPX has come done meaningfully in the last few days, now at 17%, but up considerably from the multi-year lows of 6% last fall.
If you are long and strong, but remain fearful of another re-test to last week’s lows in the coming days/weeks, it might make sense to take advantage of elevated volatility levels and look to overwrite stocks or etfs that you own.
For instance, if I were long the SPY, the etf that tracks the SPX, I might look to sell an out of the money call in March. WIth the SPY closing at 265.10 you could sell the March 271 call at $2.75. If the SPY was at 271 or lower on March expiration you would receive the $2.75 in premium, or about 1% in premium. While that does not seem like much, it is creating a call-away level of $273.75, up 8.3% from Friday’s low and giving a small buffer to the downside.
But we also know that index etf premiums are generally lower than its components. Lets look at the SPX’s largest component, Facebook (FB) a stock that is down about 9.5% from its all-time highs made on Feb 1st. 30 day at the money implied volatility in FB is at 30%, well above its 1yr average of about 20%:
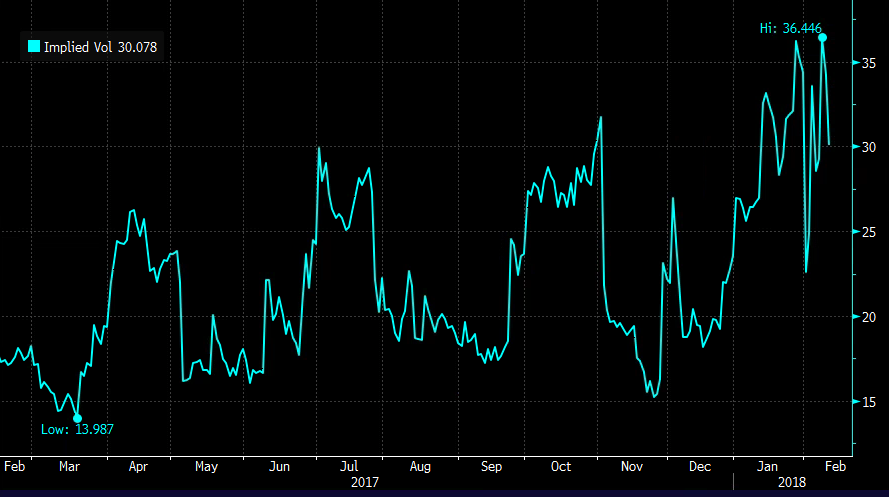
If you were long FB, but of the mindset that the stock would take some time to make a new high as the broad market finds its legs, it might make sense to sell an out of the money call very near the prior highs.
For instance, vs 100 shares of FB long at $176.40, you could sell 1 March 190 call at $1.50. While that does not seem like a lot, it is a little less than 1% for about a month with a call-away level at $191.50, up 8.5% from current levels, and just below the prior highs.