Apple will report their fiscal Q1 results tonight after the close. The options market is implying about a 4.5% move in either direction, rich to its 3.25% average move following the last four quarters. With the stock at $167,25 the Feb 2nd weekly 167.50 straddle (the call premium + the put premium) is offered at about $7.25, if you bought that, playing for movement greater than expected in the options market, then you would need a rally above $174.75 or a decline below $160.25 by tomorrow’s close to make money.
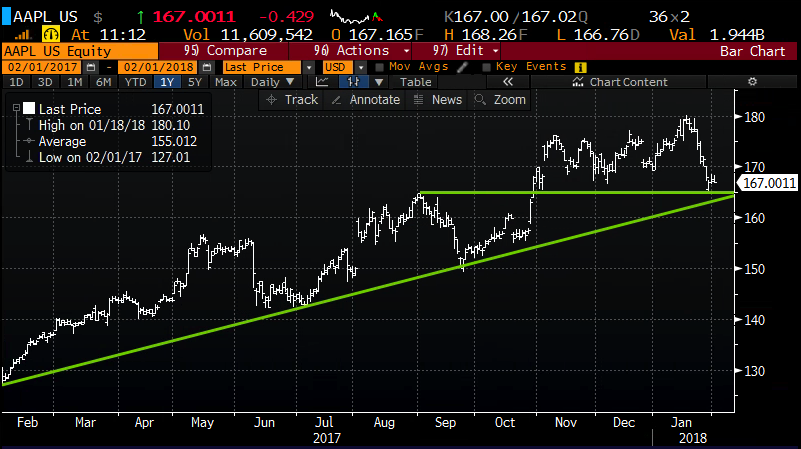
The stock’s 7% decline since its mid-January all-time high is based on concerns of weak demand for their iPhone X, causing them to dramatically cut orders for the device in the current quarter. Obviously that makes for a challenging trading set-up for a couple of reasons. First, the way the X was rolled out in November, plus its increase in price point relative to the normal September release which they did for the 8 & 8+ at lower price points will make for a very complicated report as it relates to overall unit demand, margins and average selling prices. If the company is able to offer some clarity on how all of these skus (SE,6,7,8 & X) offer them greater flexibility in geographic expansion and further penetration in current saturated markets (Apple just hit its highest market share in North America at 44%) then the stock will likely be back on its way to prior highs. I guess most importantly, the stock has massively underperformed many of its mega-cap tech peers over the last few months. Basically, it is trading where it was three months ago after their Q4 report. The sentiment is bad in the very near term. But the company is a massive beneficiary in the longer term of tax reform and is repatriating hundreds of billions of dollars at a very low rate. So it’s trading well below a market multiple, with an inclination to massively return cash to shareholders with the potential for services growth break 20% of total sales in the coming quarters. Therefore the stock may only have limited downside if we see weak March guidance, and that news might already be in the stock at current levels.
I will add that the stock did stop on Tuesday right where it had to, bouncing off the late Oct breakout point which is also the intersection of the one-year uptrend. Below that support, the stock has support in the mid $150s:
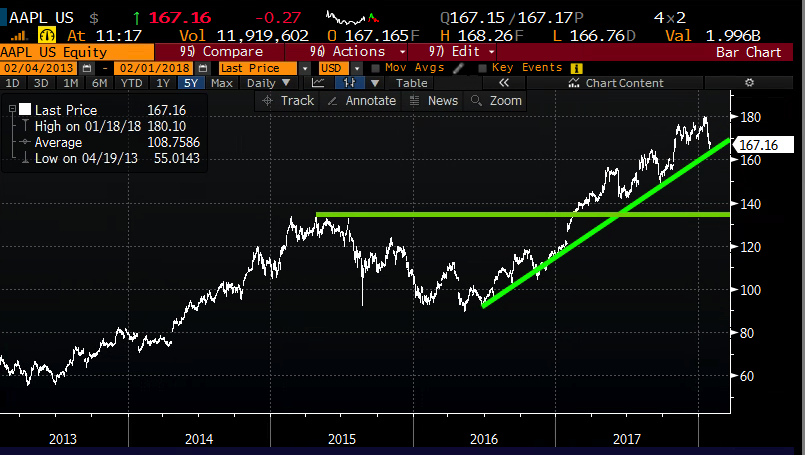
The fun thing about technical tourists like me drawing lines on charts is that you can see what you want to see at different time frames. To my eye on a five-year basis that the stock is now approaching the uptrend from its 2016 lows that capped a 33% peak to trough decline, and real long-term support is at the prior breakout to new all-time highs back in early 2017 near $135:
To be clear for the stock to be headed back to long-term support it would take a few things. First, and most importantly, any indication that there was isn’t an iPhone Upgrade supercycle coming this year, which in my opinion was a major pillar of the bull story last year. That theory was that 200-300 million iPhones in use were at least 2-3 years old and we’d see a mojority of those go in for upgrades. Furthermore, if the company’s $50 yoy increase in iPhone 8 & 8+ and the entry-level $1000 price point is causing elongated upgrade cycles then investors might sit out 2018 until they see a material increase in sales of services, which carry much higher margins than hardware. They may be also be able to shrug off bad news on upgrades if they see material uptake in nascent markets like India. But I am not holding my breath for either in 2018.
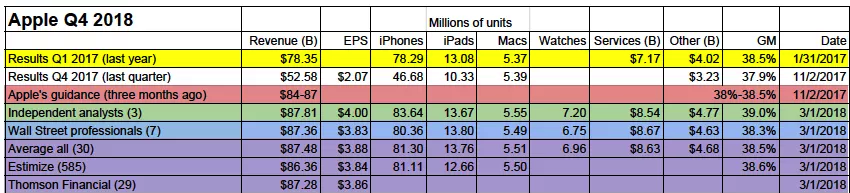
Here is a great summary of expectations by product compiled by Apple Blogger Philip Elmer-DeWitt:
So what’s the trade?
If I were long and looking for near-term protection for a post-earnings drop of greater than the implied move then I might consider a low cost put spread collar that allows for more near-term upside, to a point but also offers a certain amount of downside protection.
For instance,
VS 100 SHARES OF AAPL ($167.25) BUY THE FEB16TH 180 CALL 165/155 PUT SPREAD COLLAR FOR $2
- Sell 1 Feb16th 180 call at 1.10
Buy 1 Feb16th 165 put for 4.20
Sell 1 Feb16th 155 put at 1.10
Breakeven on Feb16th:
Gains or losses in the stock between 169.25 and 180 (current stock price plus $2 paid for the hedge)
Stock Called away in the stock above 180 on Feb expiration, but can always buy back short call to keep position intact.
Protection of up to 13 between 163 (long put strike less $2 paid for hedge) down to 155, losses in the stock below 155.
Rationale – For a little more than 1% of the price of the stock this hedge protects up to 7.7% in potential losses if the stock were to decline below 155 between now and Feb 16th. Below 155 the protection ends but that is a fairly significant move from these levels in a short period of time (down 10%, more than double the implied movement). The 180 call sale finances the put spread so a move above 180 means being called away in the stock, but that is also a significant move and the hedge can be closed with mark to market losses vs more significant gains in the stock if the stock threatened that level.
OR if I were inclined to play for a bounce back to the prior highs I might consider the following trade idea:
Bullish, targeting the prior high of $180:
AAPL ($167.25) Buy Feb 2nd weekly 167.50 call for 3.40
Simple… risk 1.4% for one day that the stock gets back at least a third of the recent sell off
As always. I’ll offer our usual disclaimer for long premium directional plays into events. You need to get a lot of things right to just make money, direction, the magnitude of the move and in this case timing, as it needs to happen on the event itself, not next week. This trade breaks even at 170.90, any close tomorrow below that and it’s a loser.