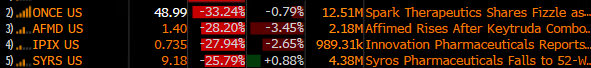
This week in Atlanta the American Society of Hematology is holding their annual conference on blood diseases where we are already seeing some massive moves in the stocks of companies reporting data from trials:
Options activity in the Ishares Nasdaq Biotech etf (IBB) is running hot at almost 2x average daily volume with one trade, in particular, sticking out. Shortly after the open when the IBB was trading $106.74 there was an opening buyer of 3500 of the Jan 105 / 96.67 put spreads, paying $1.70, or nearly $600,000 in premium. This trade breaks even at $103.30, down about 3.2% from the trading level, and offers profit potential of up to $6.63 between $103.30 and $96.67, or up to $2.3 million at $96.67 or lower, down about 10% from the trading level.
The reason for the weird strike is that last month the etf split 3 for 1.
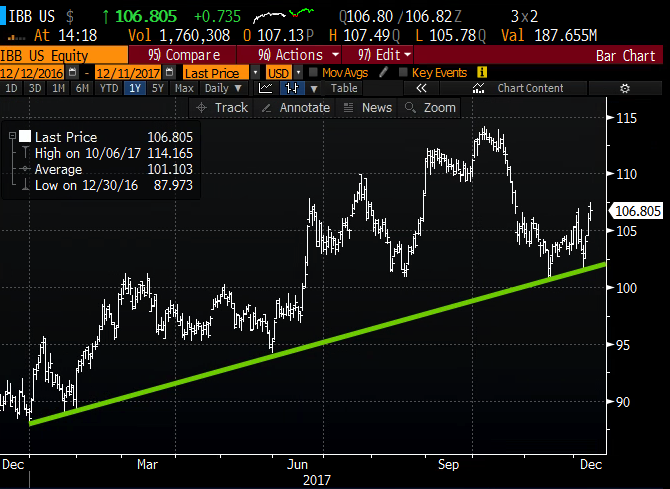
Taking a quick look at the one year chart of the IBB, the long put strike in this spread of $105 makes some sense when you consider that routine bounce off of the uptrend, with the most recent being very near the break-even of this trade near $103ish:
I suspect this trade might be protection against a basket of biotech stocks, but obviously, I have no idea without intimate knowledge of the trade and the trader’s intent.
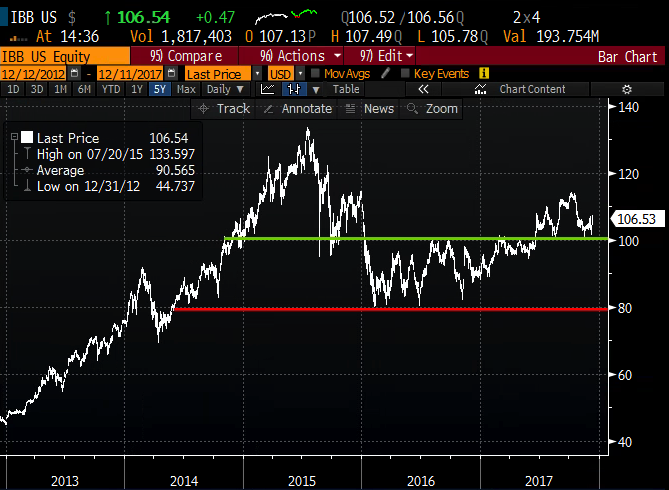
Why might this investor be looking for protection if in fact that is what it is? Well from purely a technical standpoint below $100 there appears to be near-term support in the mid to high $90s, but below that there is an air pocket to the low $80s:
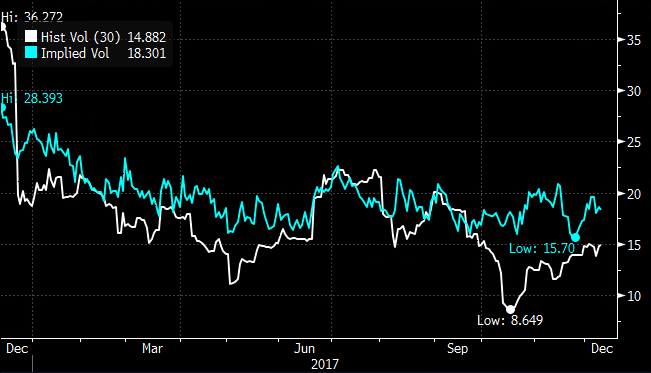
Short-dated options prices have bounced a couple points from the recent 52-week lows, with 30 day at the money implied volatility at 18.3% (blue below) while 30 day at the money realized vol (white line below, how much the etf has been moving) has also picked up from 52 week lows, but remains a few percentage points below implieds:
If I were inclined to make a bearish bet in January in the IBB, I might consider selling a short dated put in Dec and buying a longer dated one in Jan with a similar break-even to the trade detailed above.
For instance, with the IBB at $106.58 I would consider paying 90 cents for the Dec 29th weekly / Jan 103.33 put calendar:
-Selling to open 1 Dec 29th 103.33 put at 50 cents
-Buying to open 1 Jan 103.33 put for 1.40
Break-even on Dec 29th weekly expiration:
This trade does best with a gradual move lower towards the 103.33 strike. If the IBB were 103.33 or higher the Dec 29th put would expire worthless and you would own the Jan 103.33 put for 90 cents. If the IBB were close to 103.33 the Jan put would pick up deltas and likely be worth a good bit more than 90 cents. The jan 103.33 put currently has about a 30 delta, if the stock were to drop a little more than $3 towards the strike, that means the option would gain close to 30 cents per dollar move, less decay. If this were the case then you might consider selling a lower strike put to lock in some of the gains in deltas, thus making a vertical put spread. Think of this as a way to potentially leg into a vertical put spread as opposed to starting with one. This trade works better than a vertical if the move is more gradual in the near term, the other better if the move is more dramtic. The max risk of this trade is the 90 cents in premium paid if the IBB were rise significantly higher than current levels or drop well below the strikes.