You know the drill with the “Dow Theory” which suggests that new highs in the Dow Jones Industrial Average should be confirmed by new highs in the Dow Jones Transport or vice versa to validate the breadth of the rally. Now we can agree that industrial and transport companies don’t have the importance they once had in our economy, and thus their performance a lesser importance in equity markets, but its probably a fairly useful exercise to keep an eye on such relationships in market that has recently set a record for the longest streak ever without a 3% pullback (close to 270 days!).
The Dow Jones Transportation Average (TRAN) is about 6% year to date, a far cry from the Dow Jones Industrial Average’s (INDU) 19.3% gains, I guess more importantly for the ‘Dow Theorists’ the TRAN is down 5% from its recent all-time highs made in October, while the INDU has made a series of new highs since the TRAN’s, including today.
It’s worth looking at some of the large Transport components to get a sense for the areas of underperformance. for these purposes, we will look at the IYT, the iShares Transportation etf, who’s top five holdings make up about 45% of the weight of the etf:
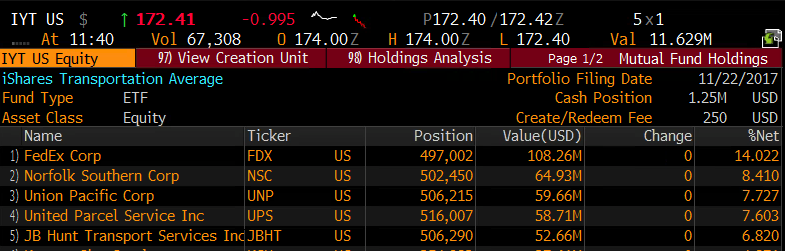
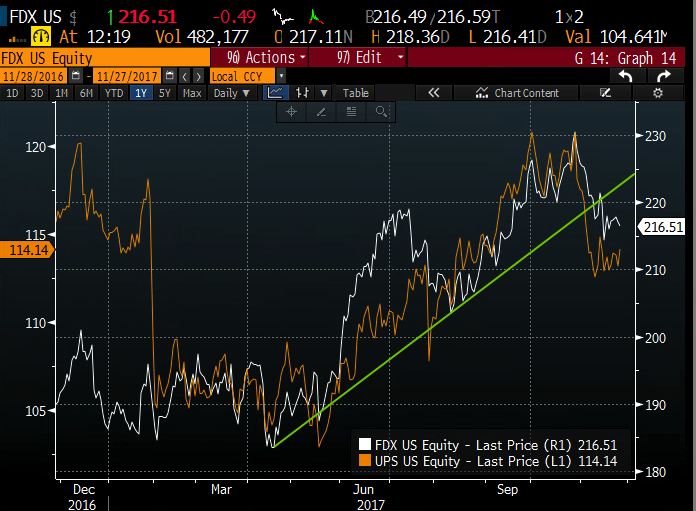
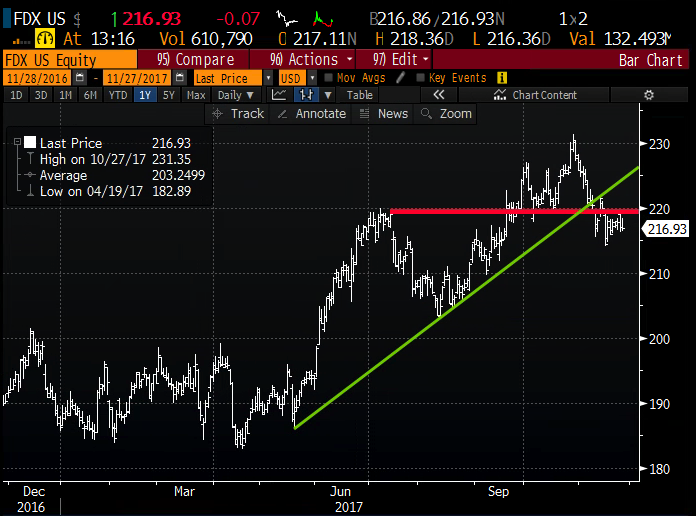
A few of these stocks stick out to me for different reasons. First, one would expect with Amazon (AMZN) making daily new highs, up 60% on the year, with all signs pointing to a blowout holiday season for the e-commerce giant, it would make sense to extrapolate that delivery companies like Fedex (FDX) and United Parcel Service (UPS) would be strong beneficiaries, yet both stocks are down about 6% in the last month, since making new 52 week highs. UPS sticks out like a sore thumb though due to its very poor relative performance ytd, down about 50 bps vs FDX’s 16% ytd gains. UPS trades 17.5x expected 2018 eps growth of 8% on 5% expected sales growth, which looks pretty reasonable on valuation, with FDX trading a similar valuation to expected growth. Both FDX and UPS are now below their uptrend’s from May:
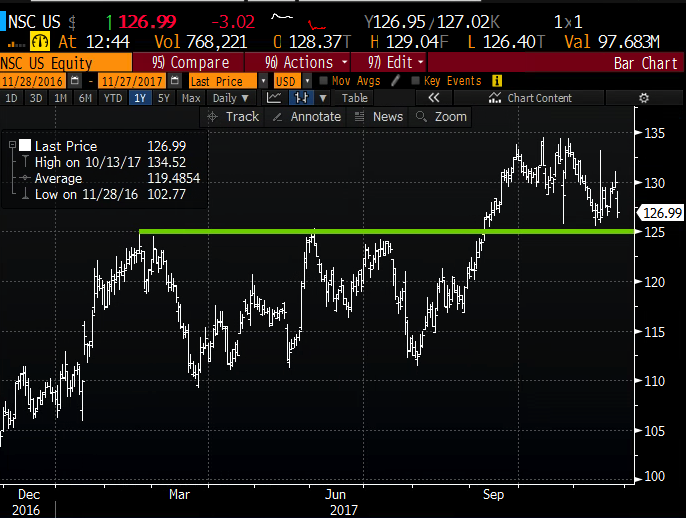
The next two stock’s in the IYT with considerable weight are Rails, Norfolk Southern (NSC) and Union Pacific (UNP), both up double-digit percentages on the year, but like FDX & UPS, both down on average about 4% from their 52-week highs made last month. Despite not confirming the highs in the INDU, these two charts look far more constructive than the prior two above, with NSC holding its Sept breakout level, which is now technical support at $125:
And UNP making a nice little bullish flag, holding $115:
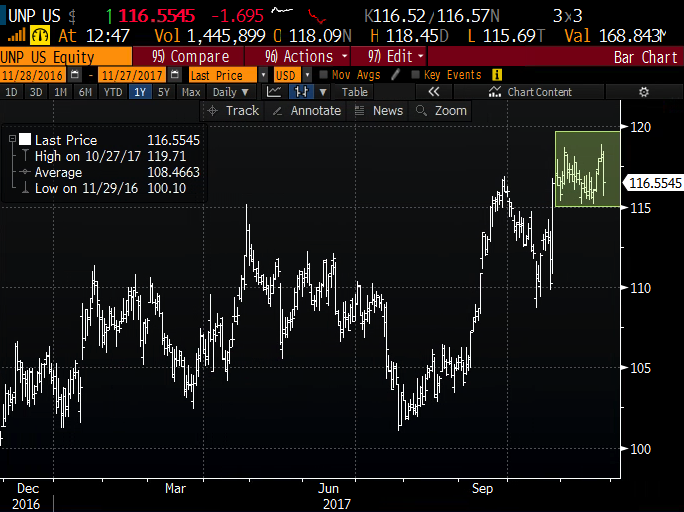
Both NSC and UNP trade at about a market multiple, with expected eps growth of about 11% on sales growth of about 5%, seems pretty fair in this market.
So the take-away for me is that Dow Theorists are likely to be a tad emboldened by the recent underperformance of the Transports, but the rails appear to be in a better technical place than the couriers.
The next identifiable catalyst in this group will be FDX’s fiscal Q2 earnings on Dec 19th. The options market is implying about an $11.50 move or about 5% between now and the close of Dec 22nd, most of that being priced for its post-earnings response. The stock has only moved about 2.3% the day following the last 4 quarterly reports. Given the recent underperformance, the upcoming catalyst and the technical setup that looks a tad heavy, a miss and/or guide down and FDX is testing its August lows near $205:
SO what’s the trade? If you are long and looking for short-term protection, or like the idea of targeting a breakdown following earnings then short dated put butterflies look like dollar cheap protection or an attractive risk-reward for directional players:
Trade Idea FDX ($217) Buy Dec 22nd weekly 215/ 205 /195 Put Butterfly for $1.75
-Buy 1 Dec 22nd weekly 215 put for $4.80
-Sell 2 Dec 22nd weekly 205 puts at 1.90 each or $3.80
-Buy 1 Dec 22nd weekly 195 put for 75 cents
Break-even on Dec 22nd expiration:
Profits of up to 8.25 between 213.25 and 196.75 with max profit of 8.25 at 205
Losses of up to 1.75 between 213.25 and 215 & between 195 and 196.75 with max loss of 1.75 above 215 or below 195.
Rationale: this trade idea risks less than 1%, for a breakeven down 1.7% offering a payout of nearly 5 to 1. As always for long premium directional trades into events, you need to get a lot of things right to just break-even, direction, magnitude of the move and timing.