Tonight after the close Cisco Systems (CSCO) will report their fiscal Q1 results. The options market is implying about a $1.50, or ~4.4% move in either direction between now and Friday’s close. If you bought that, and thus the implied move between now and Friday’s close you would need a rally above $35.50, or a decline below $32.50 to make money. CSCO has moved on average about 4.5% the day following the last 4 quarterly reports, which is shy of its 10-year average one-day post-earnings move of about 5.6%.
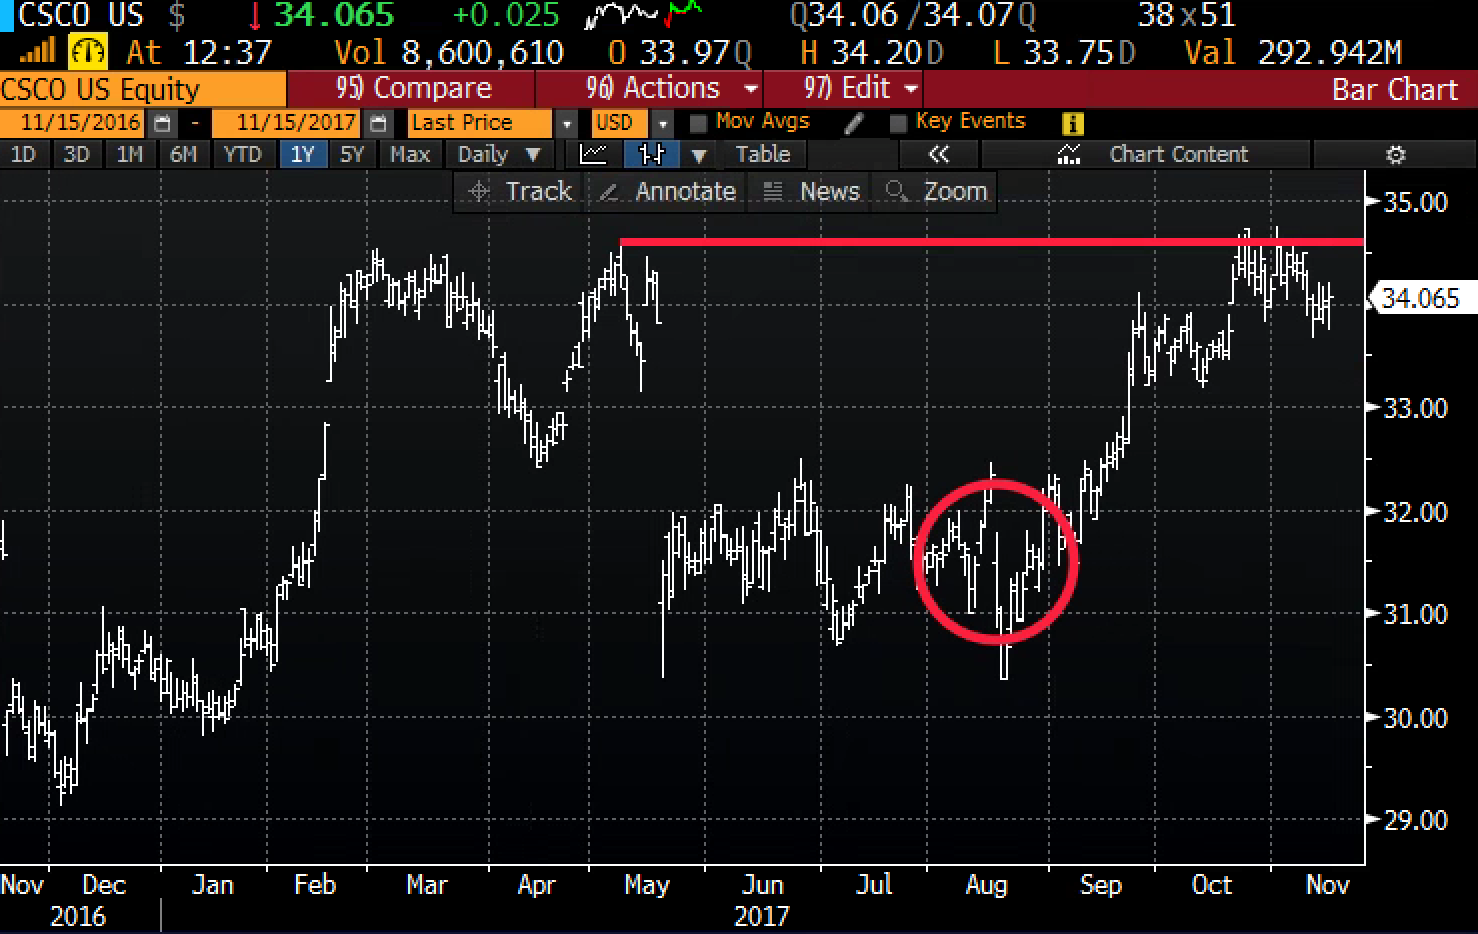
Shares of CSCO have underperformed the S&P 500 (SPX) in 2017, up only 12.5% vs 15%, and woefully lags the Nasdaq’s 25% gain. The stock’s year to date gains have all come since the days following its fiscal Q3 post-earnings decline in mid-august, with the stock now just 2% from its 52 week high made earlier in the month:
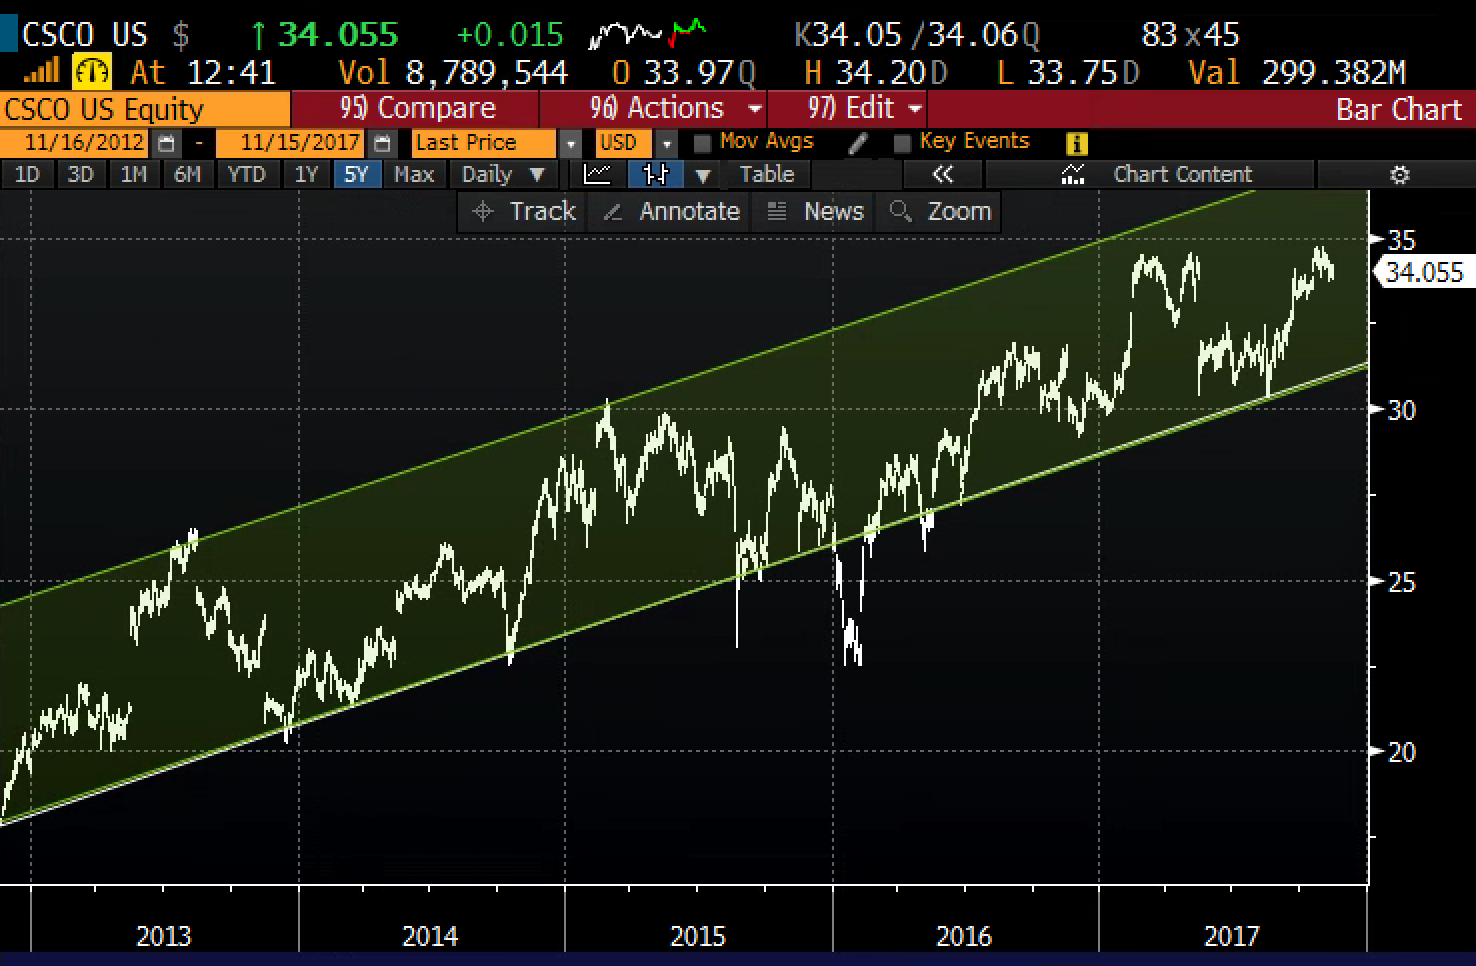
While the stock has had its fits and starts over the last 5 years, it has generally been in a well defined uptrend making a series of higher highs and higher lows (excluding the Q1 2016 market volatility) and looks to have decent near-term support near the uptrend at $32ish and little overhead resistance above the recent highs:
And for those of you who caught Intel’s rally in the last couple months, as it broke out above very long term technical resistance, now eyeing dotcom highs from the year 2000… CSCO has a sort of similar look to it:
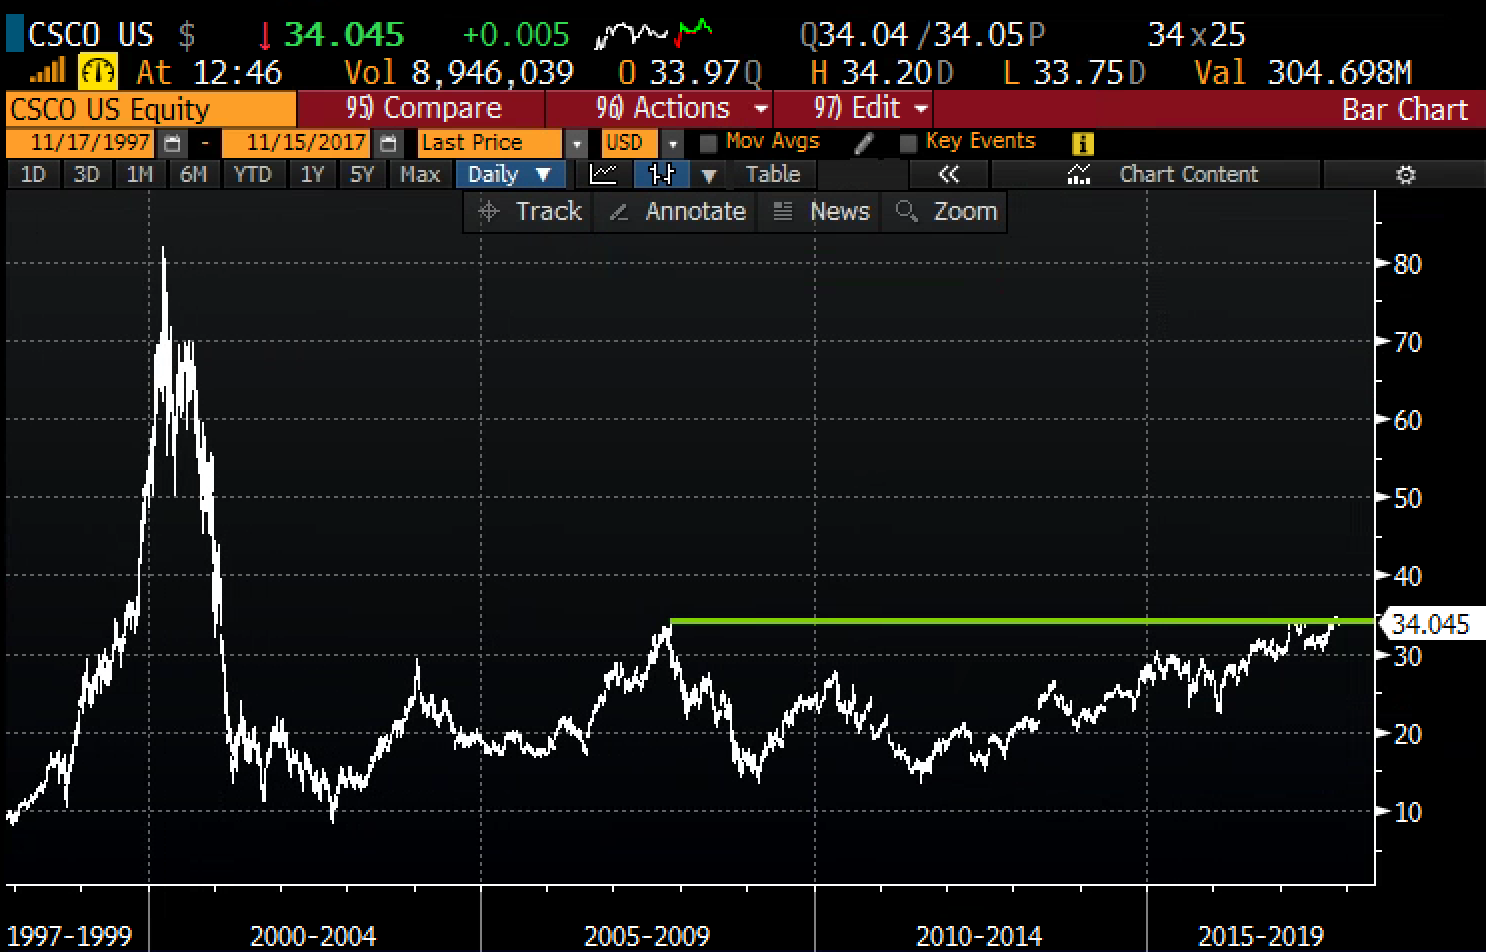
With the Nasdaq essentially at all-time highs, and CSCO well below its all-time highs made in 2000 its worth noting before assuming catch up in all big cap tech that the company’s eps and sales growth have ground to a halt (low single digits and flat respectively). On the plus side, relatively new leadership has been rejiggering the business, placing less emphasis on legacy businesses and investing in higher growth businesses in the cloud, through an aggressive m&a strategy which will likely continue for years. The company has 41% of their $162 billion market cap in cash (22% net of debt), buys back tons of their stock, pays a dividend that yields 3.4% and the stock trades at only 13x.
For those looking to play for that potential breakout with defined risk it makes sense to leave room to run to the upside farther out than just the event itself. There’s really nothing stopping a breakout on good news from continuing into year end. Therefore Dec or Jan makes more sense than short term. For example:
Bullish/ Stock Alternative
CSCO (34.18) Buy the Dec 34/38 call spread for .93
- Buy 1 Dec 34 call for 1.02
- Sell 1 Dec 38 call at .09
Breakeven on Dec expiration: Losses of up to .93 below 34.93 and gains of up to 3.07 above. Max gain at $34.
Rationale – This plays the move higher on any good news to continue into year end. It’s premium will get hit as implied vol decreases after the event, but on a breakout it’s dollar cheap enough that that wouldn;t be an issue if the stock is higher in line with the expected move.
…
On the flip side, especially for those already long the stock, a move lower on earnings also probably gets pressed into year end as people give up on the stock for some of the reasons listed above. So a hedge that protects on a move down to $30 while allowing unlimited upside makes sense:
Hedge/ Bearish
CSCO (34.18) Buy to open the Dec 33/30 put spread for .45
- Buy 1 Dec 33 put for .55
- Sell 1 Dec 30 put at .10
Breakeven on Dec expiration: Losses and Gains in the stock above 33, gains unlimited above. Loss of up to .45 on the hedge above 32.55, hedged (or gains if outright) of up to 2.55 below 32.55 down to 30.
Rationale – You don’t want to spend alot of money on this, but you also don’t want to sell an upside call in case the stock breaks out. Therefore a slightly out of the money put spread keeps this strategy dollar cheap.