Facebook (FB) will report their Q3 results tonight after the close. The options market is implying about a 5% one-day post-earnings move (or about $9) tomorrow which is rich to its average of about 3% over the last four quarters, but below its 6.75% average since going public in 2012.
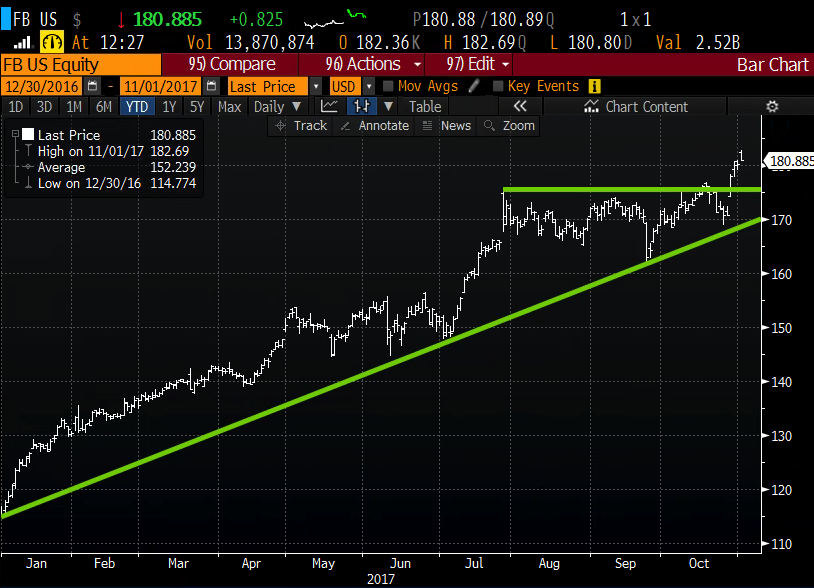
Shares of FB are trading at all-time highs, up on the year a staggering 57%! The year to date chart of FB is a work of art, making a series of higher highs and higher lows, with new highs coming after a period of consolidations. The stock’s recent breakout to new all-time highs should serve as mild near-term technical support, while the uptrend from the Jan lows might be the obvious checkback level on any disappointment with results:
Wall Street analysts remain overwhelmingly bullish on the stock with 43 Buy ratings, only 2 Holds and 2 Sells with an average 12-month price target of $201, about 10% higher than where the stock is currently trading. Longtime and unwavering bull on the stock, RBC’s Mark Mahaney highlighted the reasons for his bullish thesis in a note to clients earlier in the week:
1) Very Large, Growing User Base – Facebook has more than 2B active users and is still growing this in the teens % Y/Y. The large amount of data collected on these users is a unique and valuable asset for ad and content targeting.
2) Engagement Still High – Although engagement levels are a constant concern, Facebook’s measure of DAU/MAU has remained consistently high on an overall company basis.
3) One of the Most “Underlevered” Internet Companies – Facebook still has many growth levers left to pull, not least of which is video advertising.
4) Mobile Overhang Addressed – Facebook has, so far, effectively addressed one of the most significant overhangs from its IPO days, the lack of Mobile monetization. Mobile Ad Revenue is now showing significant growth and becoming a material part of the overall Ad Revenue mix (88%).
5) Very High Margins – FB currently drives EBITDA margins in the low-60%s. An outlook for increased opex investment should drive these down, but we think that increased investment is actually a positive at this point in the company’s
growth.
Mark highlights the following items to focus on in tonight’s report:
1) User Growth and Engagement: Facebook has continued to grow users at an impressively robust pace off a very large base. In Q3:17, we are estimating Y/Y MAU growth of 14% to 2.04B. For Q3, we are also estimating a slight Q/Q increase in the DAU/MAU ratio to 66.1%, up 10bps Y/Y.
2) Advertising Revenue Growth: For Q3, we are modeling an Ad revenue growth rate (ex-FX) of 45%, down from 49% in Q2 on a 4pt easier comp.
3) Margin Levels: For Q3, we are looking for a 43.1% GAAP operating margin, down 130 bps Y/Y, and a 61.8% Adjusted EBITDA margin, down 280 bps Y/Y. FB has stated that 2017 will be an aggressive investment year.
My personal view is that it would take a meaningful guide lower coupled with some sort of unforeseen regulatory action for the stock to materially give back some its 57% ytd gains between now and year-end. Investors will try to hold on to their massive outperformers like FB and look to book gains, and thus create a tax liability in 2018 a year in which taxes are likely to be less than they are in 2017.
Heading into tonight’s print long holders might consider protective collars, allowing for further upside while defining risk to the downside. The implied move would take the stock to about 190 on the upside, so all call sales to finance a put spread should be above that. The weekly 190c (sold) vs buying the 177.5/170 put spread for about .35 is an inexpensive hedge for the event itself, protecting fairly close to the stock but allowing for room to the implied move on the upside. Looking farther out, for greater downside protection, it makes sense to go a bit higher on the call sale:
FB ($181) Buy the Dec 195c -170 /150 put spread collar for even money
- Sell 1 Dec 195 call at 2.50
- Buy 1 Dec 170 put for 3.00
- Sell 1 Dec 150 put at .50
Breakevens on Dec expiration:
Gains in the stock between 181 and 195. stock called away at 195, up 7.7% on Dec expiration, which would be up about 65% on the year. It is important to remember that when you are short a call vs long stock and the short call is in the money, the investor can always buyback the call prior to expiration to keep the long stock position intact.
Losses capped of the stock between 181 and 170, but losses mitigated between 170 to 150.
Rationale – This protects for any large moves lower on this event and out over the next month and a half. If the stock were to make a move towards 200 by year end this hedge would show losses but much less than the gains in the stock and can be taken off at any time to allow the stock to run.
OR
A less cut and dry hedge is to but one that could make sense for those not worried too much about a big move lower on the event itself but one that could continue into year end on bad news is to consider put calendars…
FB ($181) Buy the Nov3rd, Dec 170 put calendar for 2.10
- Sell 1 Nov3rd 170 put at .90
- Buy 1 Dec 170 put for 3.00
Breakeven/Rationale: This does best of the stock declines on the event but not significantly lower than 170. Any move lower and the trade/overlay will gain, any move higher and it will lose value. If the stock closes above 170 on Friday it simply becomes a Dec 170 put and can be further spread, reducing cost/risk. This allows for unlimited upside if against stock, and defined risk if outright. If vs stock it does not protect against a massive sell-off into this Friday, but finances that protection for after this week.