By late June, Crude Oil had round-tripped its entire post-election bounce, but since then, it has put in what technicians might refer to as a double bottom.
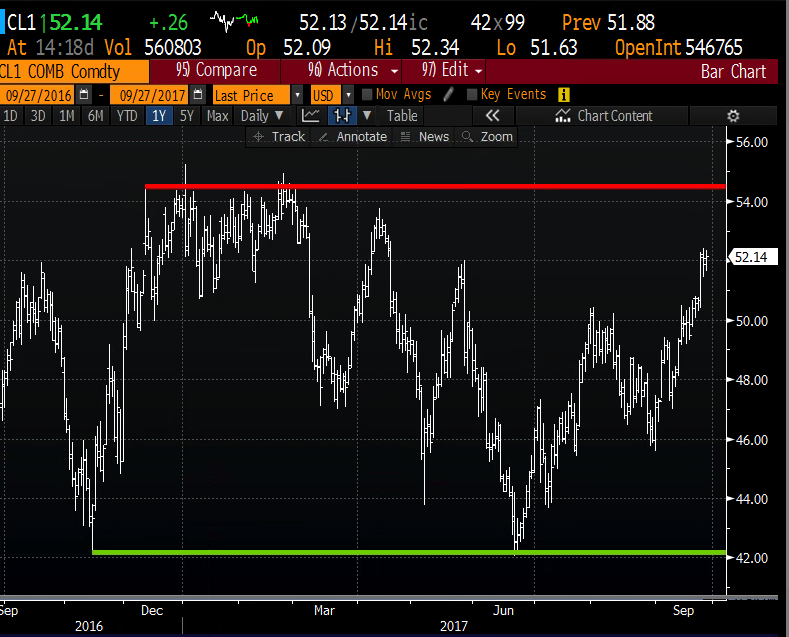
After being in major correction territory, down more than 17% from its early Jan highs, the commodity is now up nearly 25% from the lows, despite still being down on the year. The commodity has fairly obvious technical resistance just above $54.
Equities in the oil patch have followed suit, after what seemed like a very well defined downtrend for the better part of the year, the S&P Oil & Gas etf (XOP) has broken trend and is now up 18% from its August lows, but still down a whopping 17% on the year:
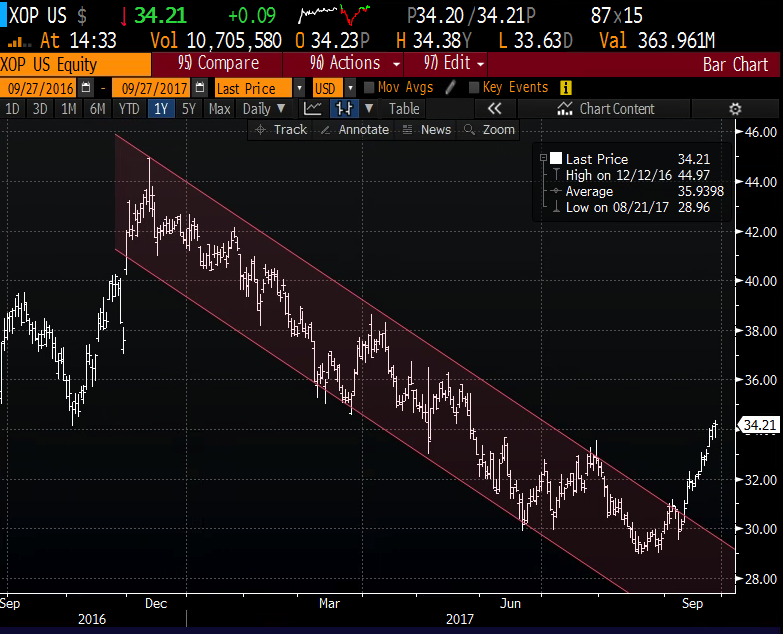
If Crude were able to break-out above the 52-week highs, I suspect you might see many of the stocks that make up the XOP rally back to unchanged, but that’s a big if as rates are starting to move higher as investors start to price QT and further rate increases which could cause the dollar to rally from 52 week lows, and which might be a headwind to crude prices.
At least one trade today was looking down in the XOP, either rolling up an outright bearish bet in Dec expiration in the XOP or rolling up some protection.
When the etf was trading 33.73 a trader sold to close 22,500 of the Dec 29 puts at 37 cents and bought to open 22,500 of the Dec 33 puts for 1.43. This new put position breaks-even at 31.57. What’s interesting about the strikes is that 29 was the breakdown level but after such a sharp bounce the trader is now looking to protect above the downtrend. This might make sense because when you look back to the brief break above the uptrend in July, it was followed by a failure that led to a new 52 week low. Maybe this trader is thinking the same could happen on a retest of the downtrend.
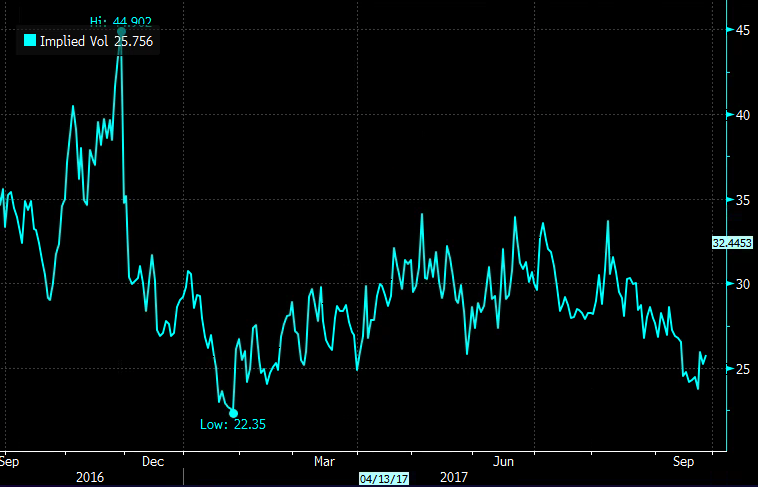
Short-dated options prices are relatively cheap with 30 day at the money implied volatility at 25%, well below the 2017 average of 33% and well below the 52-week highs of 44%, possibly making long premium directional strategies attractive for those with a view:
So this trader is either playing for a failure at resistance here, or hedging a long position against that into year end. A failure here would mean a pullback sooner than later. So one way to play for that is a near term is the Oct 34/32 put spread for .50. It offers a nice payout of 3 to 1 on a pullback to 32 and could be quickly profitable with a breakeven of 33.50. This is the type of trade that you’d likely want to take profits in on a quick reversal in the etf, and maybe get lucky on a large quick move in the next few weeks. A 50% stop on premium at the risk means closing the trade if it loses .25 with the etf higher.