- Shares of Texas Instruments (TXN) are trading within 1% of its all-time high made on Friday, and up 20% on the year, slightly underperforming the Philadelphia Semiconductor Index (SOX) which is up 24% ytd. This morning Bernstein Research highlighted the stock’s premium P/E multiple at 20x next year’s expected eps which analysts think will grow 4%, but per Barron’s suggests this may be a tad misleading relative to peers:
Bernstein chip analyst Stacy Rasgon today reiterates an Outperform rating on shares of Texas Instruments (TXN), and a $95 price target, arguing that while some think the stock is expensive at 20 times forward earnings, the shares are quite reasonable considering the company doesn’t play games with its accounting and doesn’t play games with the tax code.
Rasgon acknowledges the 20-times multiple of forward earnings is “a bit above” peers such as Maxim Integrated Products (MXIM), at 18.7 times, and Analog Devices (ADI), at 17.2 times.
However, “viewing TXN through the same lens of other peer companies proves to be somewhat enlightening,” given that TI reports only in GAAP terms, rather than “relying on gimmicks,” and pays full taxes, rather than “choosing to optimize taxes.”
Rasgon goes through the “choices” TI has made that make its shares appear more expensive but that he thinks are good choices:
Some of TXN’s premium can be chalked up to their outstanding execution and relentless articulation of their cash return strategy (one occasionally gets what one pays for in this life). But, some of it is driven in part by a number of “choices.” For example, many of our companies benefit from reporting standards that are significantly looser than TXN, utilizing various non-GAAP metrics (for example excluding the impact of share-based compensation or amortization); some have even been deliberately loosening their standards in recent years (we’re looking at you, Intel). In contrast, TXN reports in a straight GAAP formulation (including stock comp as well as amortization from the NSM deal). We are not going to get into a GAAP vs non-GAAP debate here (some exclusions may be warranted, and we believe shareholders looking a little deeper can make their own decisions on such things). Nevertheless, on a pure screening exercise these types of elements will always make TXN look a bit more expensive than peers. Taxes, however, are an even bigger driver of the valuation gap. Alone in our coverage (and perhaps in the industry?) TXN is a full taxpayer, choosing to fully repatriate their offshore cash so as to have it available for easy return, without relying on tax optimization or gimmicks. Consequently, TXN’s tax rate is in the ballpark of 30%, vastly higher than peers who tend to be anywhere from 15% on down, in many cases reaching into the low single digits. In fact, TXN’s higher tax rate is a much bigger factor of the valuation gap than their conservative accounting.
If one were to use the same approaches as other companies, writes Rasgon, such as excluding stock-based compensation, it would “take a full turn off the P/FE,” knocking the multiple down to 18.6 times. And if it had that lower tax rate of, say, 15%, the multiple would be just 16.8 times.
Rasgon emphasizes “we are NOT suggesting that TXN should begin playing games with their accounting or tax presentation,” and he notes that “tax reform again appears to be on the table, which could act as a possible additional catalyst” for the shares.
It’s pretty amazing in this day in age to find a company that reports GAAP earnings, pays full freight on overseas cash and expects to pay about 30% in taxes in 2017.
Since TXN’s mid-August lows the stock has rallied about 10% in nearly a straight line breaking out to a new all-time high from a five-month consolidation:
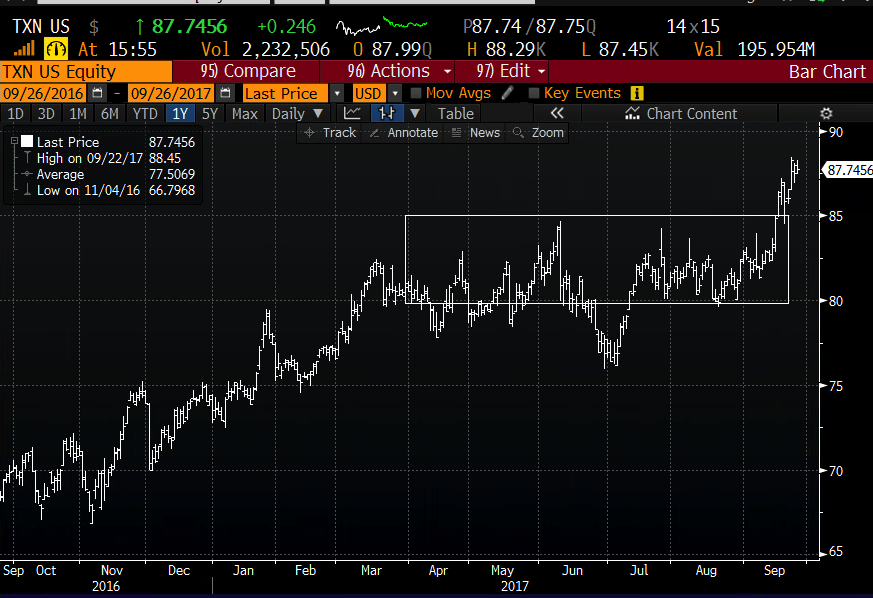
The next identifiable catalyst for TXN will be its Q3 earnings which are expected (not yet confirmed) in the last week of October. The options market is implying about a $4.25 move between now and the close on Friday Oct 27th or about 5% in either direction. This implied movement might includes the earnings event, but the stock has not been a big mover over the last four quarters at just about 1.5% the day following results.
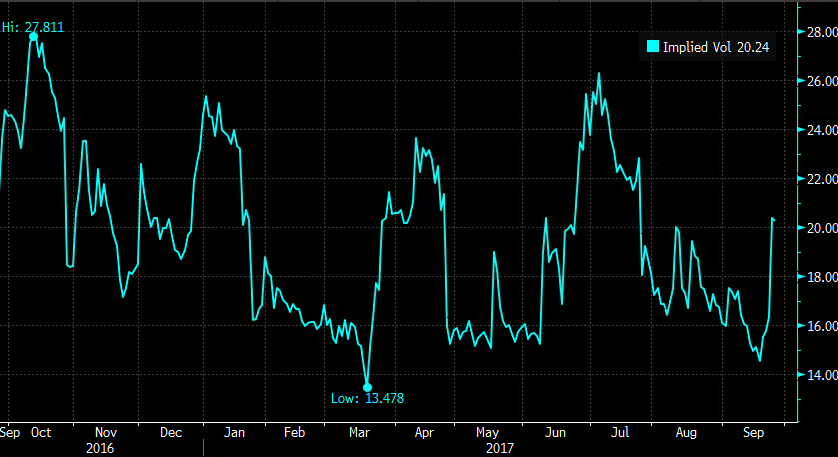
Short dated options prices have started to pick up over the last couple weeks as the stock has rallied to new highs, with 30 day at the money implied volatility at 20%, likely on its way to the mid 20s by earnings in late Oct:
If I were inclined to play for a pullback towards $80 post results I might consider a put calendar, selling a near dated out of the money put and buying a longer dated one that catches earnings of the same strike. For instance….
Trade Idea: TXN ($87.70) Buy Oct 6th weekly / Oct 27th weekly 86 put spread for $1
-Sell to open 1 Oct 6th weekly 86 put at 40 cents
-Buy to open 1 Oct 27th weekly 86 put for 1.40
Break-even on Oct 6th weekly expiration: Max gains with stock near 86. Losses possible with stock higher or substantially lower.
Rationale – this is an inexpensive way to play for a pullback near term which then leaves more ways to win into earnings. If the near put expires worthless the position can them be turned into a vertical put spread for earnings.