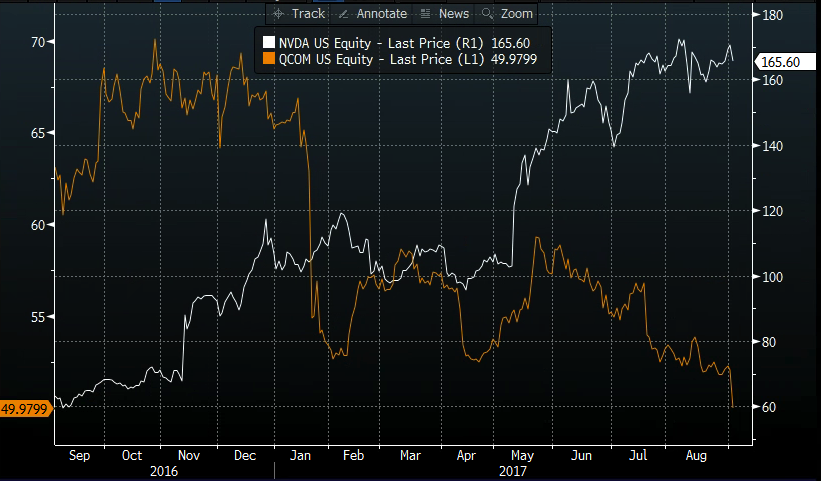
The Semiconductor etf, the SMH is down 1.4% as I write, outperforming the Nasdaq’s 1%. There are two outliers worth noting in the space today, first the best-performing stock in the etf ytd, Nvidia (NVDA), up 55% on the year, the third largest weighted stock in the etf at 6% is down about 2.7% (was down 4% earlier), while Qualcomm (QCOM), one of the worst performing semi stocks ytd (down about 24%), and the sixth largest weighted stock in the etf (5.2% of the weight) is down about 4%, making a new 52 week low.
Talk about a tale of two cities, QCOM last year at one point sported a $100 billion market capitalization (now $73 billion), while NVDA is nearly 200% higher than last September’s lows with a market cap hovering around $100 billion and just 5% from all-time highs made last month. The chart below shows these two stocks over the last year and fairly adequately reflects investor disinterest in chip companies that predominantly sell into smartphones and their desire for those who are seeing rapid growth in emerging technologies like AI, autonomous cars and cryptocurrency mining.
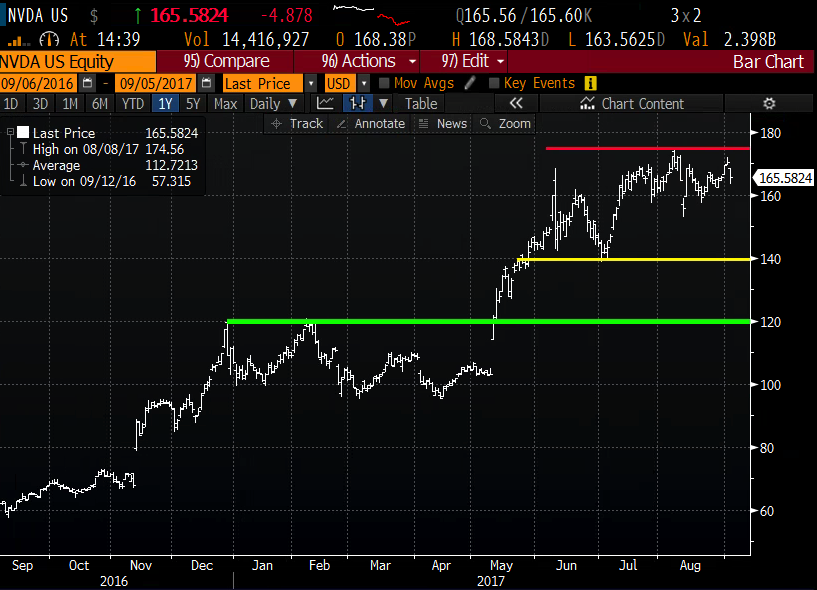
NVDA’s nearly 2-month consolidation above $160 is nothing short of impressive, but there is clearly an air pocket below to $140 on bad news or a broad market sell off, with massive support at the May breakout level of $120. And yeah above the prior highs (near $175) there is no overhead resistance:
While investors have clearly been willing to pay up for growth, or the prospect of takeout in the semi space, NVDA might be nearing a top in sentiment for both. At $100 billion, assuming a 25% premium (minimum) on a takeout from current levels there are few companies that could make it work with the stock trading about 11x its current expected fiscal year (2018) sales! Those sales are expected to grow 30% yoy, like its adjusted earnings, but both are expected to meaningfully decelerate in fiscal 2019 to 11 & 13% respectively. Without continued beat and raises, NVDA might be vulnerable to the May breakout level. The next identifiable catalyst for NVDA will be their fiscal Q3 results that should drop in early November.
Short dated options prices in NVDA are relatively cheap, with 30 day at the money implied volatility at 34% (blue line below), just off of a 2017 low, and actually below its 30 day realized volatility (how much the stock has been moving over the last month, white line below) at 40%.

If you were inclined to play for movement one way or the other, long premium directional strategies look more attractive now then they have for some time.
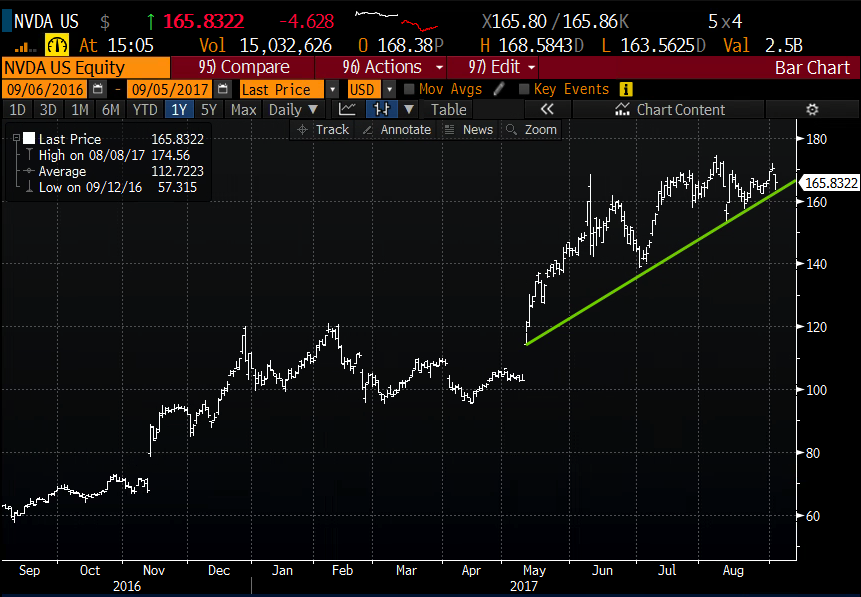
I would also quickly mention that the uptrend from the May earnings gap is worth keeping an eye on:
If I were inclined to play for a pullback towards the May breakout, targeting fQ3 earnings I might consider the following trade:
NVDA ($166) Buy Nov 160 / 125 / 90 Put Butterfly for $7
-Buy to open 1 Nov 160 put for $9.30
-Sell to open 2 Nov 125 puts at 1.20 each or $2.40 total
-Buy to open 1 Nov 90 put for 10 cents
Break-Even on Nov expiration:
Profits: up to 28 between 152 and 97 with max gain of 28 at 125
Losses: up to 7 between 160 and 152 & between 90 and 97 with max loss of 7 below 90 and above 160
Rationale: while short dated options are relatively cheap, longer dated out of the money puts that capure events like earnings are elevated a but and I would look to use trade structures like a butterfly that will look to mitiagate a bit of this. While this trade idea break-seven down a little more than 7%, the potential payout at long term support of 4 to 1 is fairly attractive, this strategy might be considered for those long the stock willing to spend a litlte premium into a potentially volatile event but still keep their long intact.