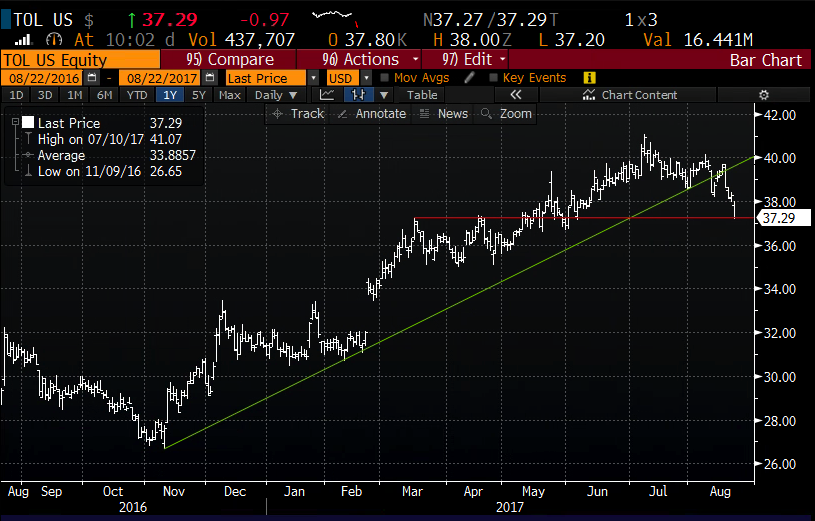
This morning high-end homebuilder Toll Brothers (TOL) reported fQ3 earnings that beat but offered guidance that was slightly below expectations. Shares of TOL are down 4% this morning, approaching near term technical support after just last week breaking down below the uptrend that had been in place since early November 2016, that from those lows had yielded 55% gains from those levels at the recent 52-week highs:
This morning the Wall Street Journal took a look at the space, The Price Isn’t Right for Home Builders, suggesting “Shares of home builders look pricey and vulnerable to a correction as costs rise and affordability is strained”:
S&P Dow Jones Indices’ broad index of home-building shares has risen 31% this year versus a gain of 8% for the S&P 500. Among the factors behind the rally: On a price-to-book basis, the shares of many home builders looked relatively cheap at the start of the year. Mortgage rates also were edging lower. Finally, home builders were seen as a major beneficiary of any corporate tax cut since, as domestically focused companies, their rates tend to be high.
But the rally has taken valuations into rarefied air. Meanwhile, home builders are facing rising costs that, low rates or not, they will find difficult to pass on to home buyers. As investors wake up to that, the prices of their shares and those of exchange-traded funds such as the iShares U.S. Home Construction ETF ITB -0.46% could drop significantly.
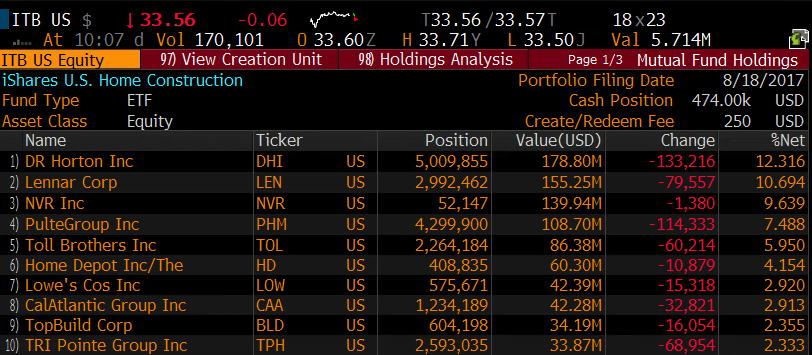
I think it makes sense to differentiate between the ITB and the XHB, which is the more liquid S&P Homebuilders etf. The top 5 holdings in the ITB are all homebuilders making up nearly 50% of the weight of the etf, via Bloomberg:
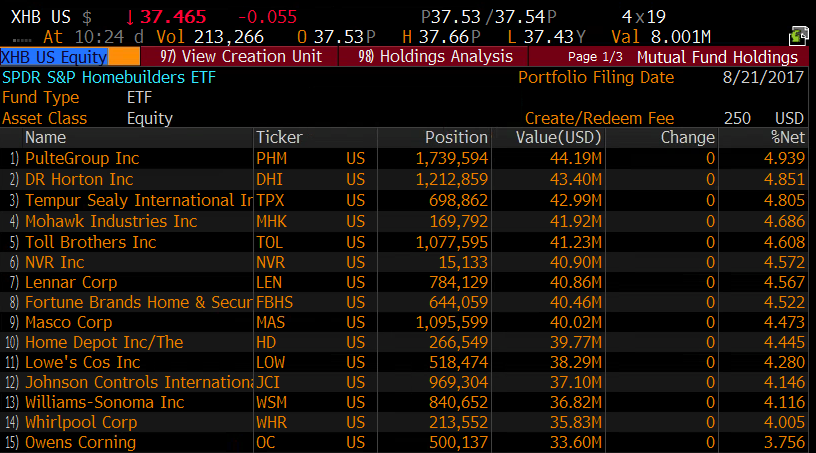
Vs the more evenly weighted XHB which has a ton of housing related retailers, appliance makers, and construction suppliers, per Bloomberg:
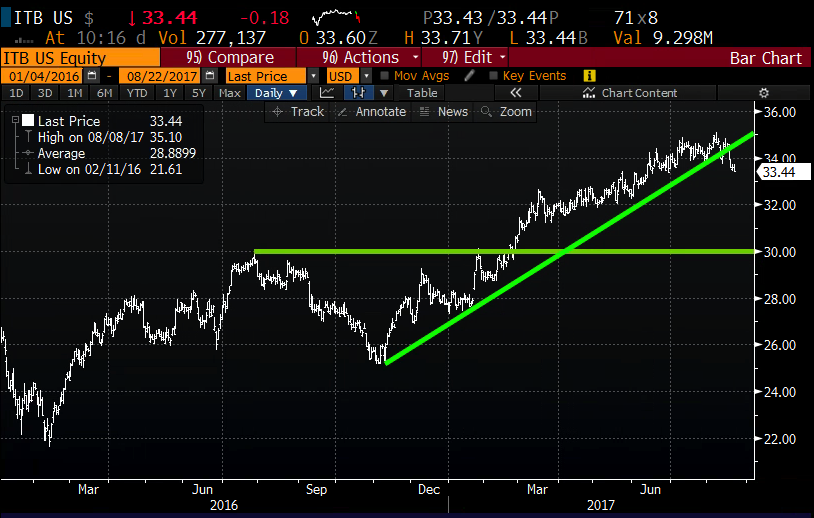
The WSJ’s view is to clearly focus on the builders for the reasons listed above. The chart of the ITB obviously resembles that of TOL, and for those who agree with the WSJ’s fundamental analysis, and also like to look at charts might worry that the recent break of the uptrend might cause a test of near term support at $32 and quite possibly a retest of the February breakout level of $30, down about 10% from current trading levels:
It’s also interesting to note that short dated options in the ITB trade by appointment, as I write 6 contracts have traded today, the average daily volume over the last month has only been about 400 contracts. But there is massive open interest in the Jan ’18 35 and 38 calls. In March of 2016 we detailed some call buying in the Jan’18 35 calls (here) and they look to have been bought at the time, and are now only mildly profitable despite the etf being higher. So it appears one investor is responsible for nearly all of the open interest, and it makes sense that the Jan’18 38 calls were sold by the same traders against the 35 strike to make a call spread.
Which leads me back to the “more liquid XHB” which has not experienced the same performance from last Fall given its exposure to retailers, but has a similar look and feel to the ITB:
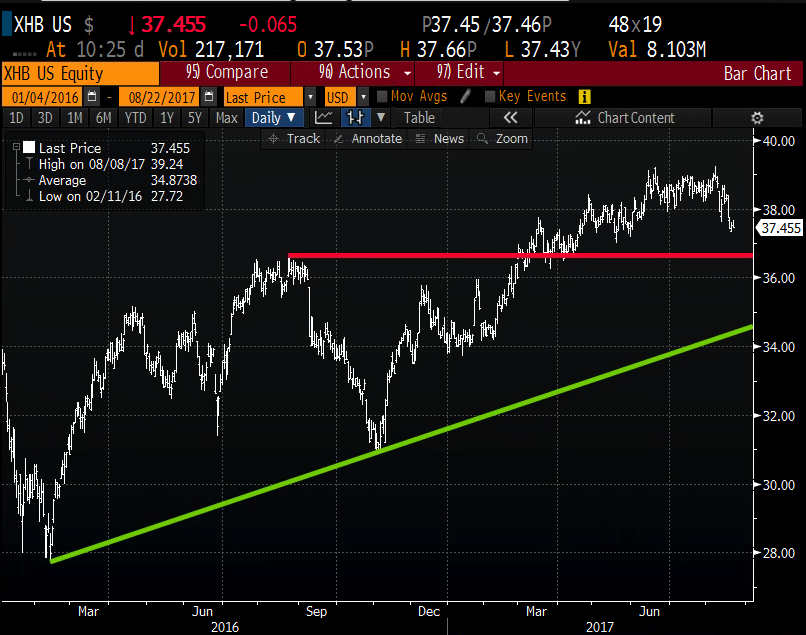
In this etf I like the idea of targeting a pullback to the uptrend that has been in place since the 2016 low, around $34.50.
So what’s the trade?
XHB (37.45) Diagonal put calendar – Sell the Sept 36 puts, buy the Dec 37 puts for 1.00
- Sell 1 Sept 36 puts at .20
- Buy 1 Dec 37 put for 1.20
Breakeven on Sept and Dec Expirations – Gains if the etf goes lower into Sept expiration. Best gains at or around 36 on Sept expiration. Losses if the etf moves higher. No losses if the etf goes way below 36 on Sept expiration. After Sept expiration the Dec puts can be turned into a vertical put spread with more gains possible below. Risk to the trade is the etf going higher at any point in the trade.
Rationale – This is a more aggressively bearish calendar than a same strike one. It provides enough room into Sept expiration for the etf to fall towards 36, at which point it will have a nice profit. After any move lower the Sept puts can be closed and rolled to Dec. The tradeoff for being more aggressive on strikes (more short deltas) is that if the etf bounces here it will need to be kept on a tight leash as the short sept puts only help by .20. A .50 stop loss on the entire trade makes sense on the upside.