Back in early June we took at a look at the relative underperformance of the prior few months of bank stocks to the broad market (read here) and leaned bearish based on the conclusion:
the relative weakness of the last few months is very much in sync with the undoing of the post-election strength of the Trump Trades, like the U.S. Dollar Index round-tripping most of the move since Nov 9th, U.S. Treasury Yields doing nearly the same, energy stocks, commodities, material stocks etc. I think Bank Stocks have completed the first leg of this move and Q2 results / Q3 guidance will confirm weak trends, coupled with a flat yield curve limiting an expected increase in net interest margins.
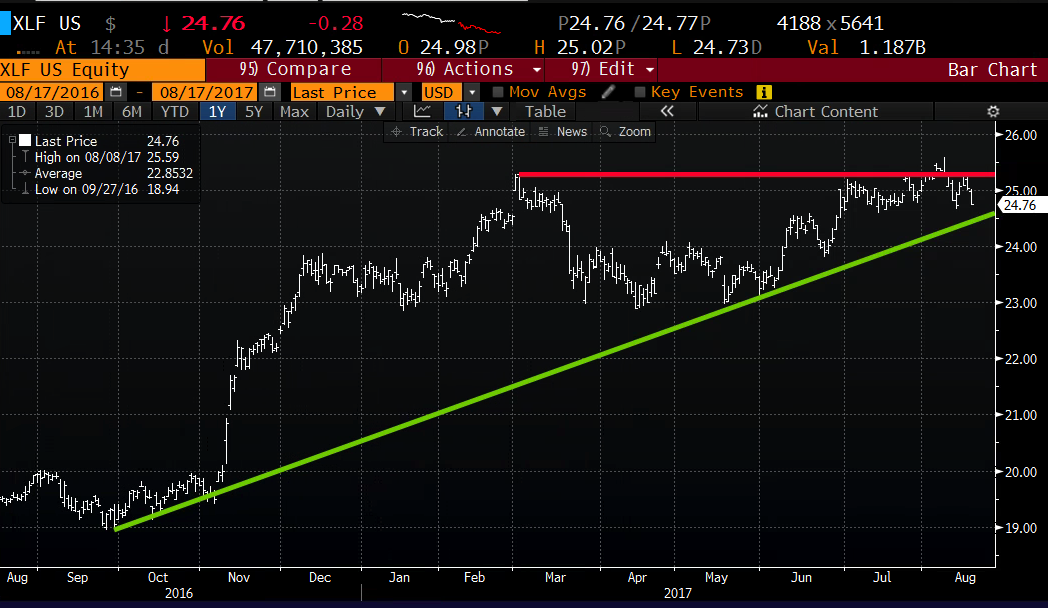
Since I wrote that the S&P Bank etf, the XLF made a new 52 week high, rallying about 5%, but failed to establish a new range above the prior highs and is now approaching what might be precarious near term technical support at the uptrend from the 52-week lows made last September:
Given the week the President has had, and the apparent discord within the White House and with his party in Congress I think it is safe to say that we can kiss goodbye the prospect for Tax Reform and financial deregulation in 2017. It’s been my view that investors in bank stocks have been hopeful these two parts of the president’s proposed pro-growth agenda would be a tailwind for profits in the space, which may soon be viewed as a headwind. Not to mention the looming showdown in Congress to fund the government next month when Congress might cause investors to dial back expectations for these companies, just as it appears the Fed has struck a slightly more dovish tone as the yield on the 10 year trades at 6-week lows below 2.2% and the prospect for a December fed funds increase sits below 35%.
Back in early June we detailed the following defined risk bearish trade when the etf was $24.25:
TRADE: XLF ($24.25) BUY SEPT 24 PUTS FOR 75 CENTS
Break-even on Sept expiration 23.25, down 4%
Now with 1 month to expiration, and the XLF at 24.75, up just 2% these puts are only worth 20 cents. Timing is everything in trading, especially for long premium directional options strategies. And in this case I was just wrong. But it makes sense to decide whether or not to leave on what is a low probability bet for profits, attempt to hold out a bit longer to recoup some of the mark to market losses or to roll the existing premium into a new bearish trade?
If I were still inclined to play for a technical breakdown in the XLF I would roll out to December expiration.
Action: XLF Sept 24 puts sell to close at 20 cents
New Trade Buy to open XLF ($24.75) Dec 24/ 21 put spread for 50 cents
- Buy to open 1 Dec 24 put for 68 cents
- Sell to open 1 Dec 21 put at 18 cents
Break-Even on Dec expiration:
Profits: up to 2.50 between 23.50 and 21, max gain below
Losses: up to 50 cents between 23.50 and 23, max loss above 24.
Rationale – From the original trade this only adds .30 or additional risk to buy much more time into the end of the year. As a new trade it offers a decent risk reward for a move lower. The breakeven of 23.50 is above support that has held for the past year and a half and even at that level the trade would be more than a double. A failure below support lies a big airpocket where this trade could be very profitable. As far as trade management any breakout above recent highs is a good place for a stop, and if the stock dips below the uptrend patience is in order, a bounce at that trendline means the trade should be kept on a tight leash.