Disney (DIS) reports their fiscal Q3 results tonight after the close. The options market is implying about a 3.7% one move tomorrow in either direction, which is rich to the average one day post earnings move of about 1.5% over the last 4 quarters, and high of the 10-year one-day post earnings average of about 3.4%.
Shares of DIS are up a mere 2.5% year to date, vs the S&P 500 (SPX) up about 11% on the year. Despite its poor relative performance in 2017, the stock is up nearly 20% from its 52-week lows made in October, very similar to the SPX, but while the SPX is making new all time highs as I write, shares of DIS are down about 8% from its 52 week highs made in April, and down 12% from its all time highs made in August of 2015.
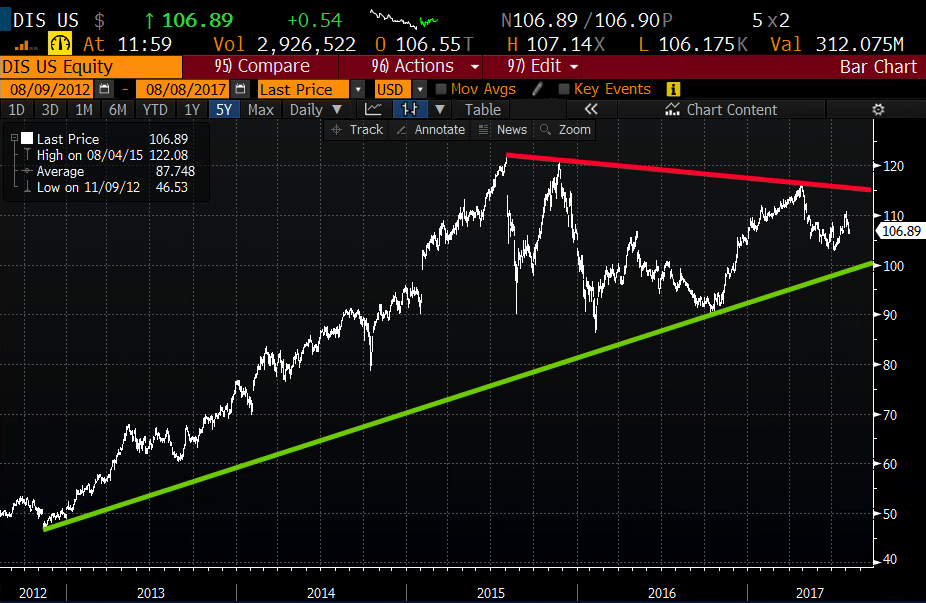
To my untrained eye, the stock appears to be in no-mans land, with technical resistance near $115 at the downtrend from the all time highs, with a lil support at the uptrend from the 2012 lows near $100, but below that an air pocket to $90:
Shares of DIS trade at about 18x expected fiscal 2017 eps that consensus has growing 3% year over year, its lowest eps growth rate since its 2009 yoy decline, and on expected sales growth of only 1%, its lowest growth rate since 2012. Looking at fiscal 2018 expectations of 14% eps growth on 6% sales growth, the stock could be viewed as cheap if investors gained confidence in their ability to achieve such growth, trading 16x those expectations.
Wall Street analysts remain mixed on the stock with 19 Buy ratings, 11 Holds and 1 Sells with an average 12-month price target of only $118, about 10% from current levels, and 4% below the prior all time high.
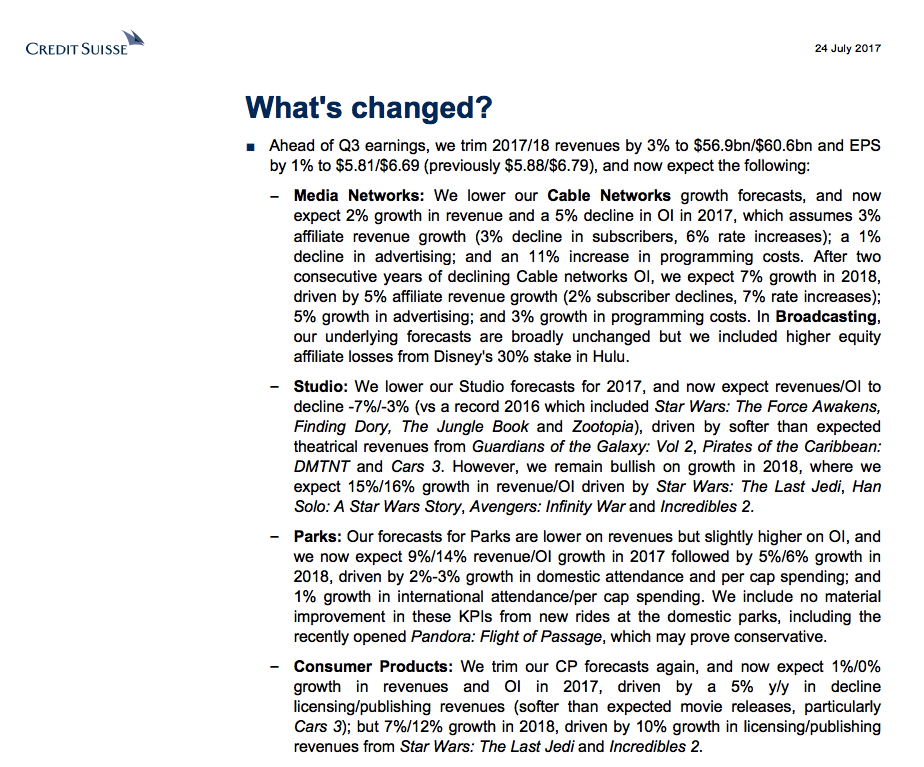
What to Expect? The good news is that Wall Street analysts have been lowering estimates for 2017 and 2018 all year. On July 24th Credit Suisse’s DIS analyst who rates the share a Buy with a $125 price target lowered estimates for all major divisions:
Investors want to see capitulation among bulls, which might signal the all clear. In the meantime, disaster hedges for longs and stock alternatives with defined risk for those looking to enter here make sense.
So What are the Trades?
Stock alt/ Bullish
DIS (106.75) Buy the Aug11th / Sept1st 106/111 vertical call calendar for 2.50
- Sell 1 Aug11th weekly 111 call at .55
- Buy 1 Sept1st weekly 106 call for 3.05
Breakeven on Friday – Gains of up to 2.50 at or above 111 with more gains possible after Friday as the Sept1st calls can be further spread. Max risk of 2.50 if the stock goes down significantly.
Rationale – This risks 2.50 to make 2.50 on the event itself but then positions for higher highers after Friday as the Sept calls will not expire. The ideal situation is a move higher towards 111 on the event. 111 is outside the implied move. The breakeven on the trade for Sept 1st is 108.50, so it’s fairly bullish, but breaks even below the implied move.
….
Hedge
vs 100 shares of an existing DIS long (106.75) buy the Aug11th 103 Puts for .55
Breakeven on Friday’s expiration – Unlimited gains in the stock above (less the .55 paid for protection), losses down to 102.45 but no losses below.
Rationale – This is disaster protection with a break even about in line with the implied move. Any moves below that and the losses will be protected.