Pepsico (PEP) is scheduled to report fQ1 results tomorrow morning before the open. The options market is implying a one-day post-earnings move of about 1.7%, which is rich to the average one day post earnings move of only 1% over the last 4 quarters, but a tad shy of the 10-year average one-day post-earnings move of about 2.2%.
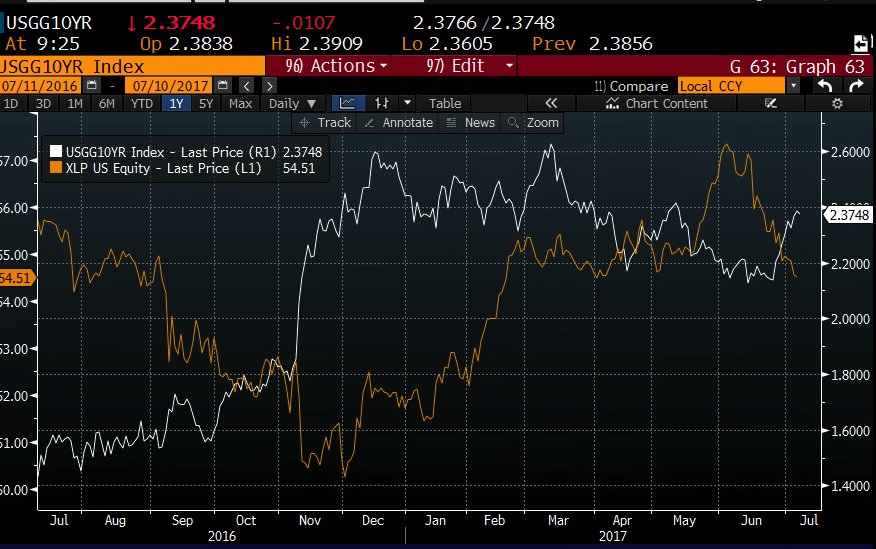
Shares of PEP are up about 10% on the year, mildly out-performing the S&P 500 (SPX) up about 8%, its peer Coca-Cola (KO) up 7% and the consumer staples etf, the XLP up nearly 7%. As US Treasury yields have risen in the last couple weeks from nearly 8-month lows, high yielding equity groups like consumer staples have softened a bit:
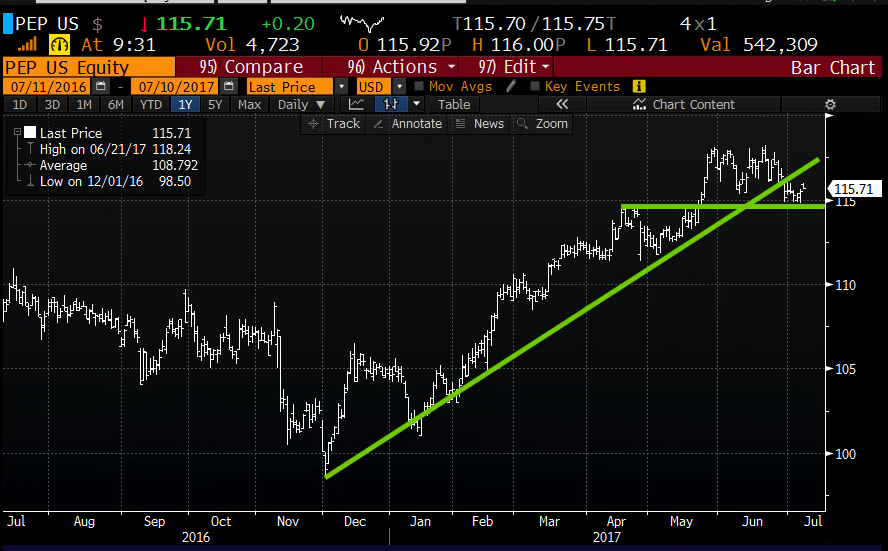
PEP has a fairly interesting technical set-up into the print tomorrow, having pulled back a few percent from a new all-time high made last month the stock found some support at the prior breakout just below $115, but has briefly broken the uptrend that has been in place from its post-election 52 week low:
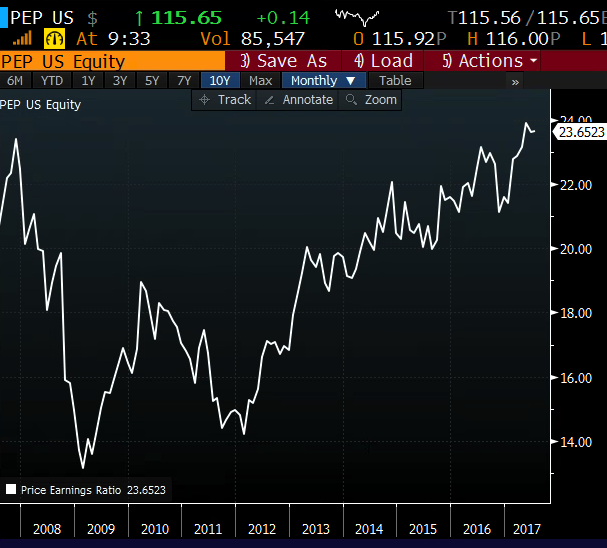
Shares of PEP traded about 22.5x expected 2017 eps growth of 6%, equal to its 2016 eps growth of 6%, with expected sales growth of only 1%. On a trailing P/E basis PEP is very near a10 year high, kind of a fat premium for that growth and a stock who’s dividend yield is now 2.79%, only 41 bps above the 10-yeTreasury yield:
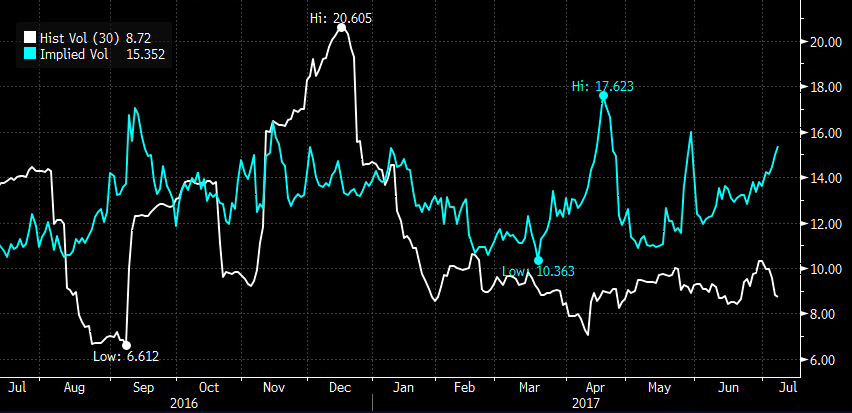
Short-dated options prices have been ticking up in the last couple weeks as one might expect into earnings while the stock has moved lower, but what’s slightly unexpected is the gap between implied volatility (the price of options, blue line below) and realized volatility (how much the stock has been moving, white line below), possibly suggesting that options prices are relatively expensive heading into the print:
So What’s the Trade?
Bullish – Stock Alternative: for those inclined to play for a post earnings bounce in line with the implied move back to prior highs, consider a weekly at the money call butterfly:
PEP ($115) Buy the July14th weekly 115/118/121 call fly for .70
- Buy 1 July14th 115 call for 1.30
- Sell 2 July14th 118 calls at .35 (.70 total)
- Buy 1 July14th 121 call for .10
Breakeven on July 14th (Friday): 115.70, losses of up to .70 below, gains of up to 2.30 above, with max gain at 118, gains trail off above 118 with losses possible above 120.30. The profit range of 115.70 to 120.30.
Rationale – This trade risks just .70 to target the prior high with a wide range of profitability. If the stock goes nowhere or down the most that can be lost is .70. That is much less than the implied move of nearly 2.70. The trade targets the implied move to the upside, right around the previous high.
….
Or for those long and consider a Hedge over the summer:
vs 100 shares of PEP ($115) Buy the Sept 110/100 put spread for .85
- Buy 1 Sept 110 put for 1.35
- Sell 1 Sept 100 put at .50
Rationale – This hedge costs .85 and allows for unlimited upside in shares for the rest of the Summer and into September. Gains in the stock above and losses below but capped at 109.15 with no losses below that until 100 where the protection ends. This is a good hedge for long term holders as it costs less than 1% of the underlying while allowing for the stock to make new highs.