Prior to Crude Oil’s 4% decline today following news that OPEC would extend production cuts for nine months, the chart looked poised for a breakout, resembling a head and shoulders bottom, with $55 serving as a neckline, with little overhead resistance above that:
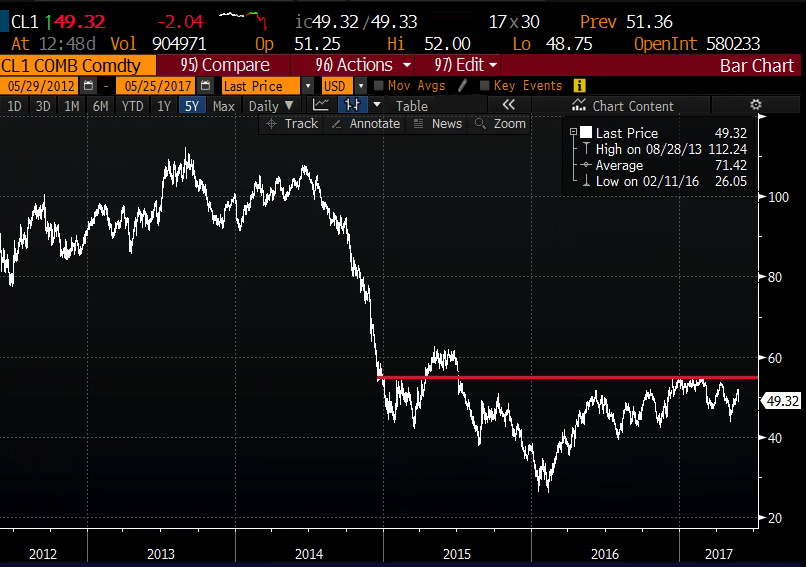
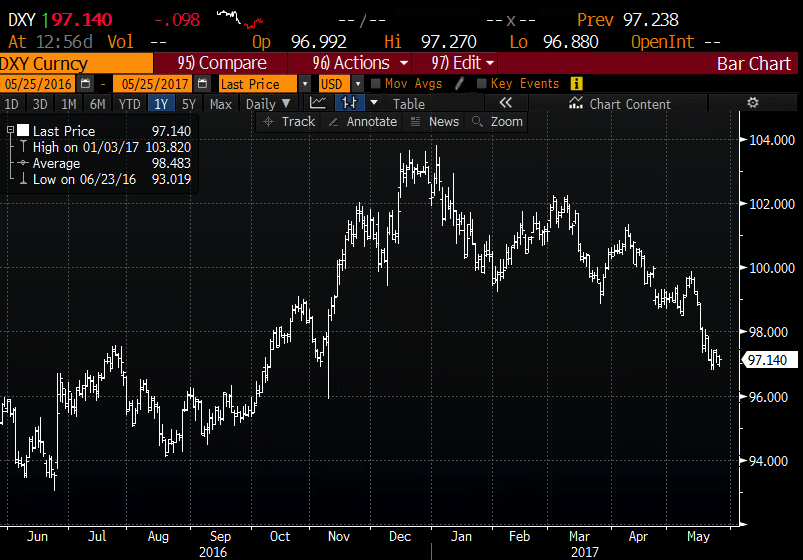
Aside from optimism about rising global growth, the commodity had remained range bound with a slight upward bias for most of the year, aided by the unexpected weakness in the U.S. dollar, down a little more than 6% from its 15-year highs made in January:
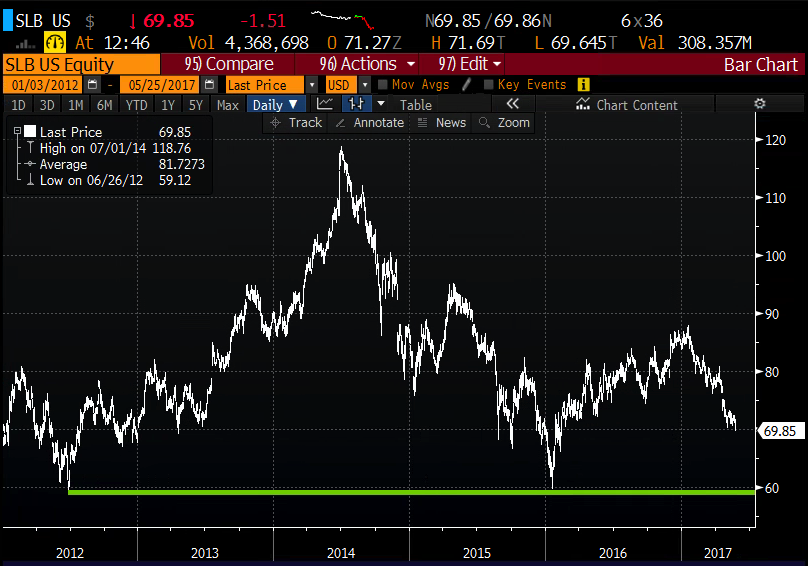
In aggregate, oil stocks, represented by the XLE (the Energy Select etf) are basically down in lockstep with the commodity, about 15% from its 52-week highs in December, and down about 10% on the year. The two largest components in the XLE, Exxon (XOM) and Chevron (CVX) make up nearly 40% of the weight of the etf, and both are down about 10% on the year. Which makes sense. But its the third largest component, Schlumberger (SLB), at 8%, that is catching my eye, down 17% on the year, today making a new 52 week low, and down about 20% from its 52-week highs made in mid-January. To be frank, SLB’s chart is a mess, and seems destined to make a run at the 2016 and 2012 double bottom low near $60 in the not so distant future, with a look of a head and shoulders top formation:
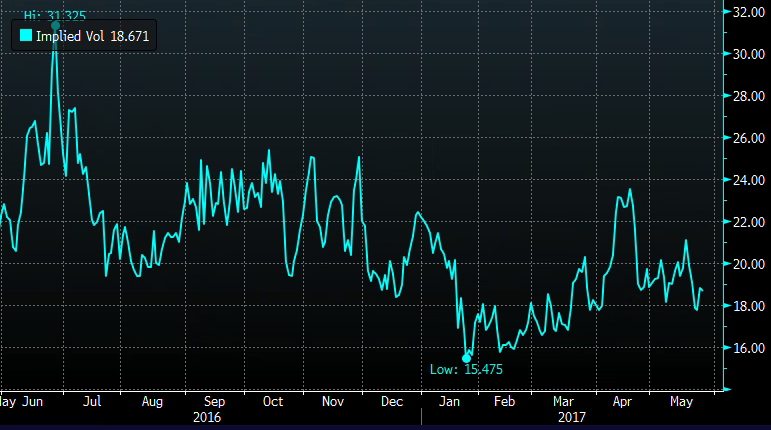
Playing for lower lows feels like a tough press on the short side, but we are kind of in a market where pressing winners and losers alike seem to be the right trade. Short-dated options prices in SLB are relatively low, with 30 day at the money implied volatility (blue line below) at about 18%, down from its pre-earnings levels in April of about 23% and its 52-week highs made last July at about 31%. What’s it all mean? for those looking to make defined risk directional bets, long premium strategies look attractive:
The next identifiable catalyst for SLB will be its Q2 earnings confirmed for July 21st, before the opening. If I were inclined to play for a re-test of $60 between now and then I might consider a put spread in July expiration, which catches earnings the morning of expiration. For instance:
with SLB at $69.40 you could buy the July 70 / 60 put spread for $2.50
-Buying 1 July 70 put for 2.70
-Selling 1 July 60 put at 20 cents
Break-Even on July expiration:
Profits: of up to 7.50 between 67.50 and 60 with max gain of 7.50 at 60 or lower
Losses: of up to 2.50 between 67.50 and 70 with a max loss of 2.50 at 70 or higher.
Rationale: this put spread is already 60 cents in the money, and risks 3.5% of the stock price, to possibly make up to 11% if the stock were to retest its prior lows between now and July expiration. For those convicted of lower lows in SLB, this trade idea offers a favorable risk-reward profile.