In case you missed it, the assumed bad Hewlett, HP Inc (HPQ), the one that was the slow growth legacy hardware business that CEO Meg Whitman split out from in Q4 2015 to form and run the faster-growing services and cloud-based businesses (HP Enterprises, HPE), has massively outperformed the latter in 2017, up 28.5% vs 8.5%. HPQ’s market cap has overtaken HPE this year $32.3 billion vs $31.3 billion. Both stocks trade well below a market multiple at about 12x, but it appears that investors are re-pricing HPQ’s prospects this year.
Tonight HPQ will report fiscal Q2 results after the close. The options market is implying a pretty sizable move following results of about 6.8% in either direction. With the stock just above $19, the May 26th weekly 19 straddle (the call premium + the put premium) is offered at about $1.30. If you were to buy that and thus the implied move, you would need a rally to $20.30, or a decline below $17.70 to make money, or about 6.8% in either direction. The stock has been fairly volatile over the last year following earnings, moving about 5.6% on average over the last 4 quarters.
Shares of HPQ are up about 110% from its Feb 2016 lows, and has recently made a new six-year high:
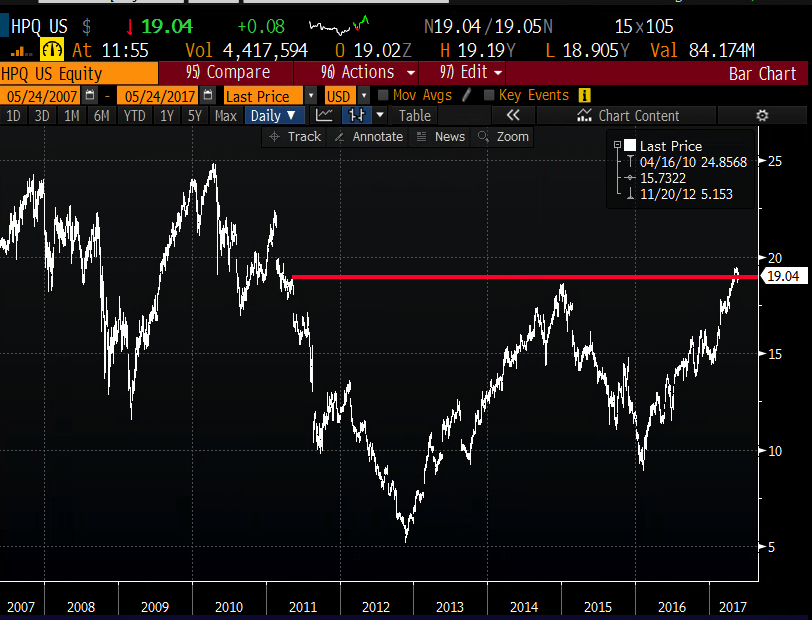
The Wall Street analyst community is nearly perfectly mixed on the stock, with 12 buy ratings, 12 holds and no sells with an average 12 month price target among them of $19.40, very near where the stock is currently trading.
The chart below highlights the high levels of 30 day at the money implied volatility (blue) heading into the earnings print, nearing 6-month highs, which is even more pronounced when juxtaposed to 30 day realized vol (white below, how much the stock has been moving), which is approaching 6-month lows:
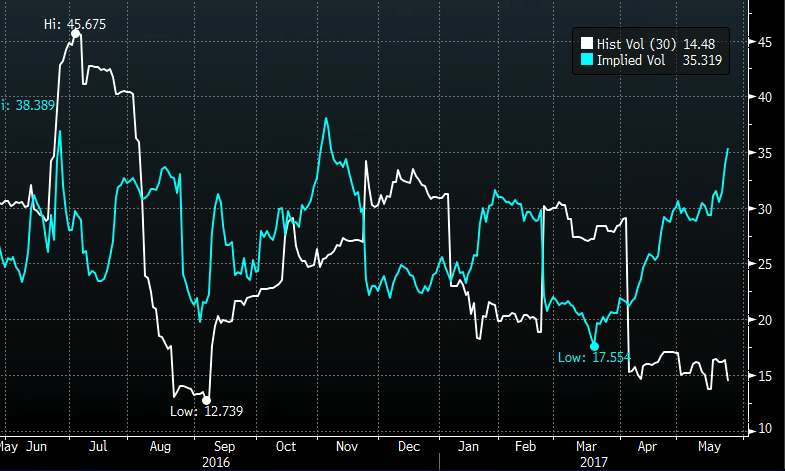
This divergence could set up as a great opportunity for those whom are long the stock to sell premium to possibly add yield, those looking to fade the implied movement or those looking to add a little leverage based on the implied move. Let’s discuss a leverage play that can be applied to lots of stocks in your portfolio:
So What’s the Trade?
Add Leverage
vs 100 shares of HPQ buy the May26th (weekly) 20.50/21 1×2 call spread for a .04 credit
- Buy 1 May26th 20.50 call for .18
- Sell 2 May26th 21 calls at .11 (.22 total)
Breakeven on Friday: Gains and losses is the stock plus the gains of .04 in the spread if stock is below 20.50. Additional gains of up to .54 if the stock is above 20.50. Stock called away above 21 but at an effective sale price of 21.54.
Rationale – The implied move is about 1.30. This ratio spread sits just above that implied move. It’s most likely outcome therefore is simply making the .04 (a wash). But… if the stock is above 20.50 it starts adding leverage to the stock up to .54 in additional profits. Think of it like a supercharged overwrite where it can add up to .54 on a move higher, not just hat is received by selling the 21 call at .11