Target (TGT) is scheduled to report their fiscal Q1 results tomorrow before the open. The options market is implying about a 6.5% move in either direction, which is shy of the average the stock has moved over the last 4 qtrs, about 8%, and about half of last quarter’s 12% one day decline.
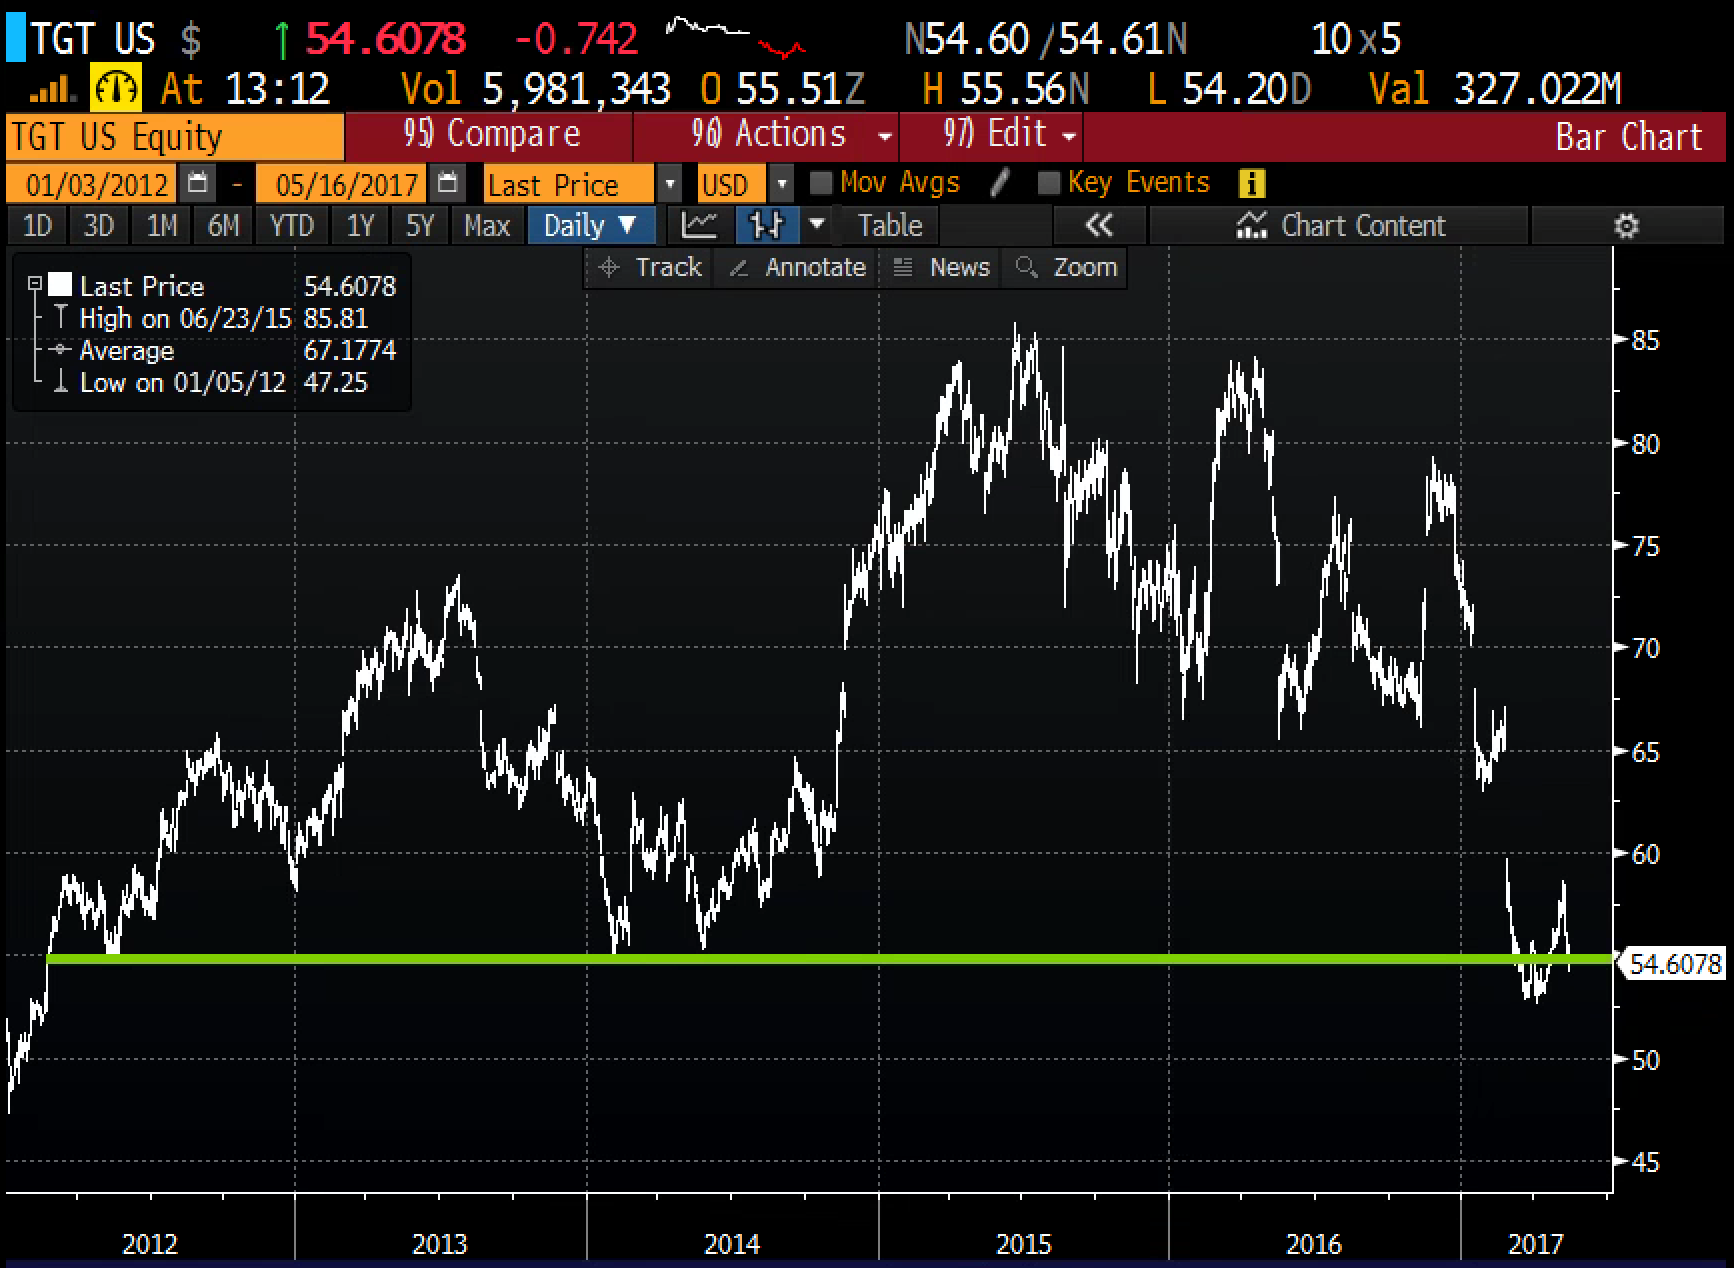
Shares of TGT are down a whopping 24% year to date, down 31% from their 52-week highs made in late November. I think it is safe to say that on an intermediate-term technical basis, $55, the level the stock broke this morning is an important support, with little technical resistance until the February gap near $60:

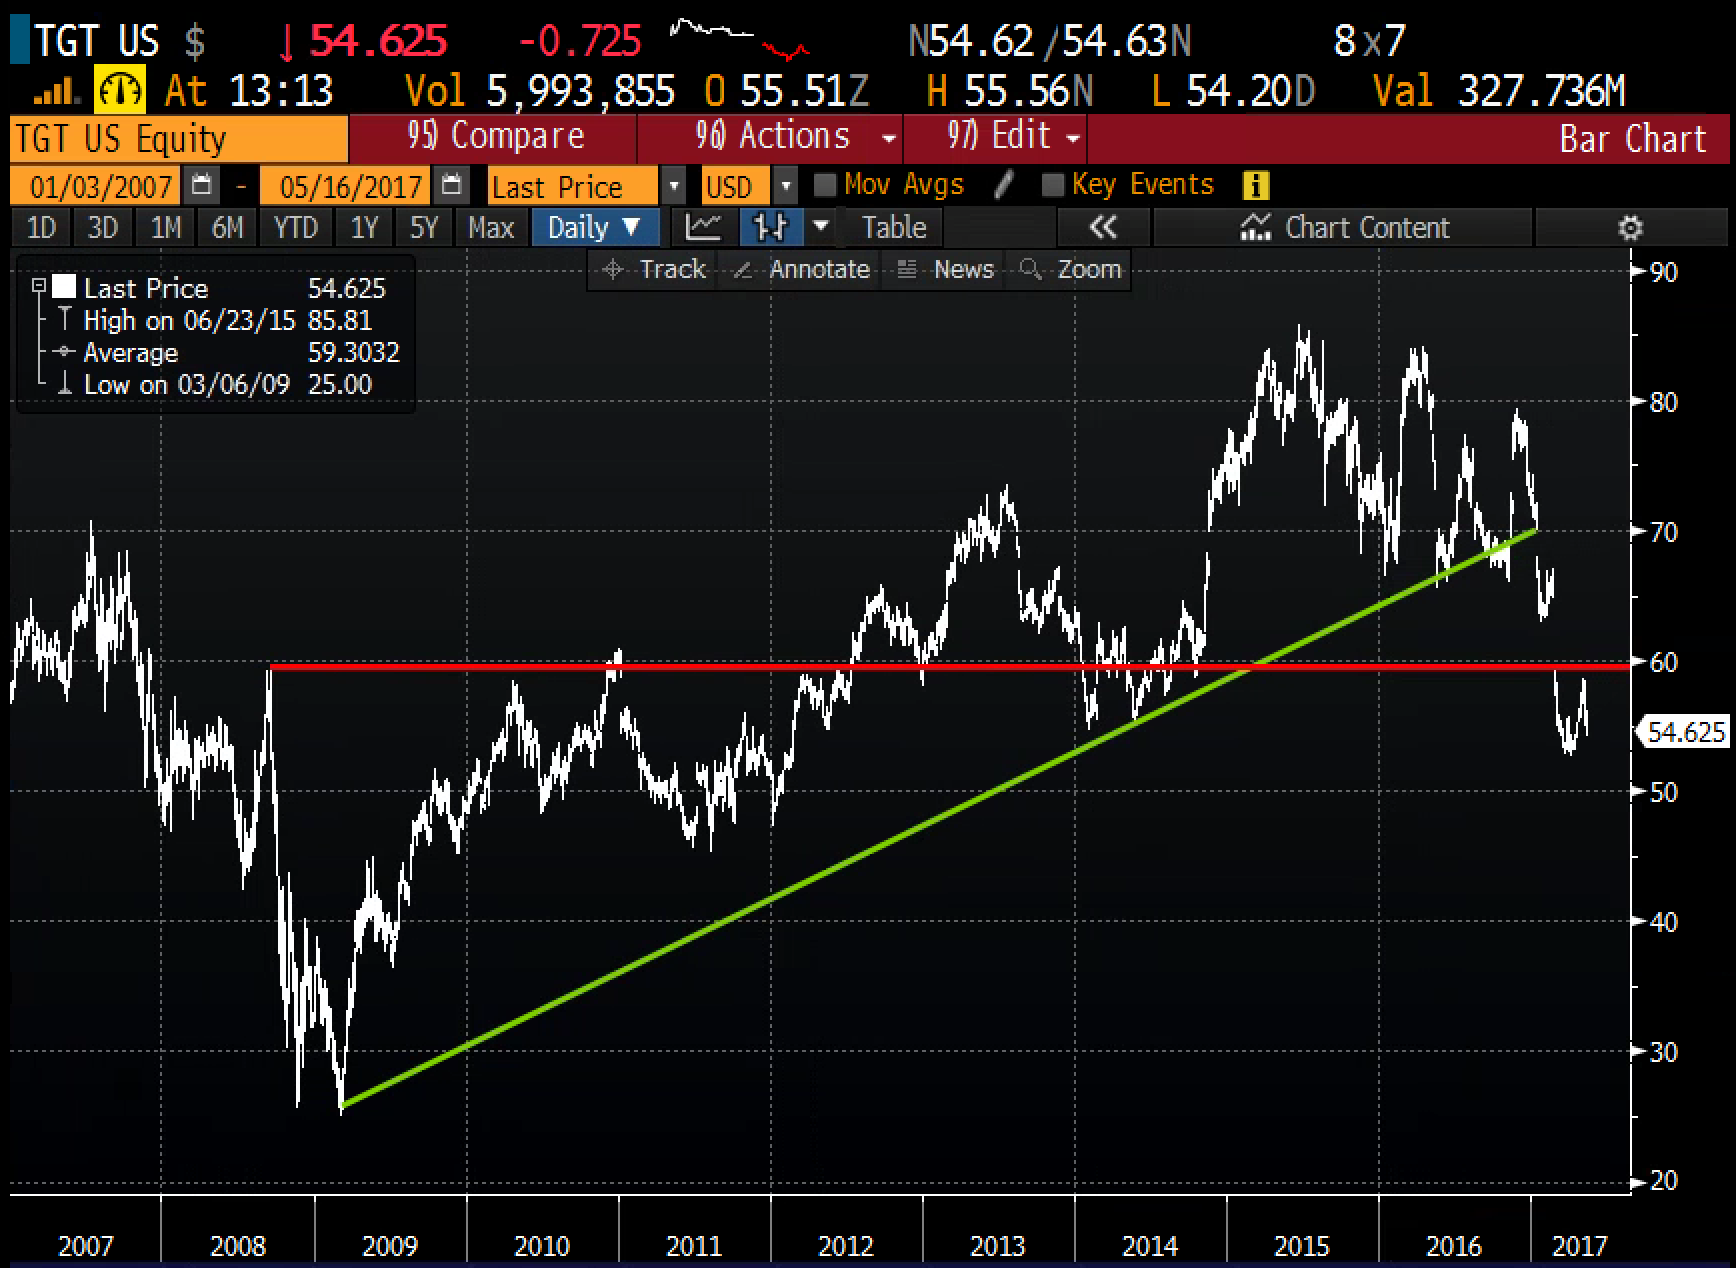
Longer term though, the chart appears to be broken with the late Feb earnings gap placing the stock below the uptrend from its financial crisis lows and below another measure of prior support near $60:

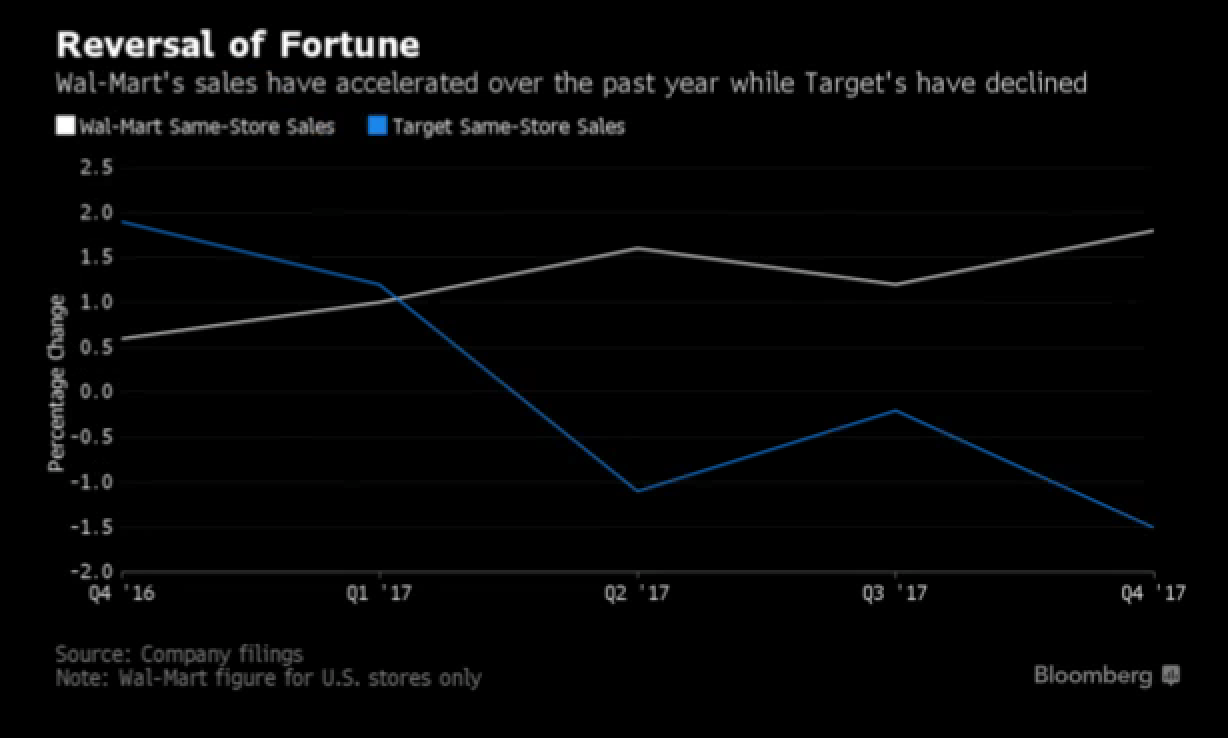
Bloomberg ran a couple charts this morning that are worthing highlighting into the print. First the diverging trend in store sales trend with rival Walmart. What should worry TGT holders is that WMT is making a huge push into e-commerce on the heals of last summer’s $3 billion of Jet.com

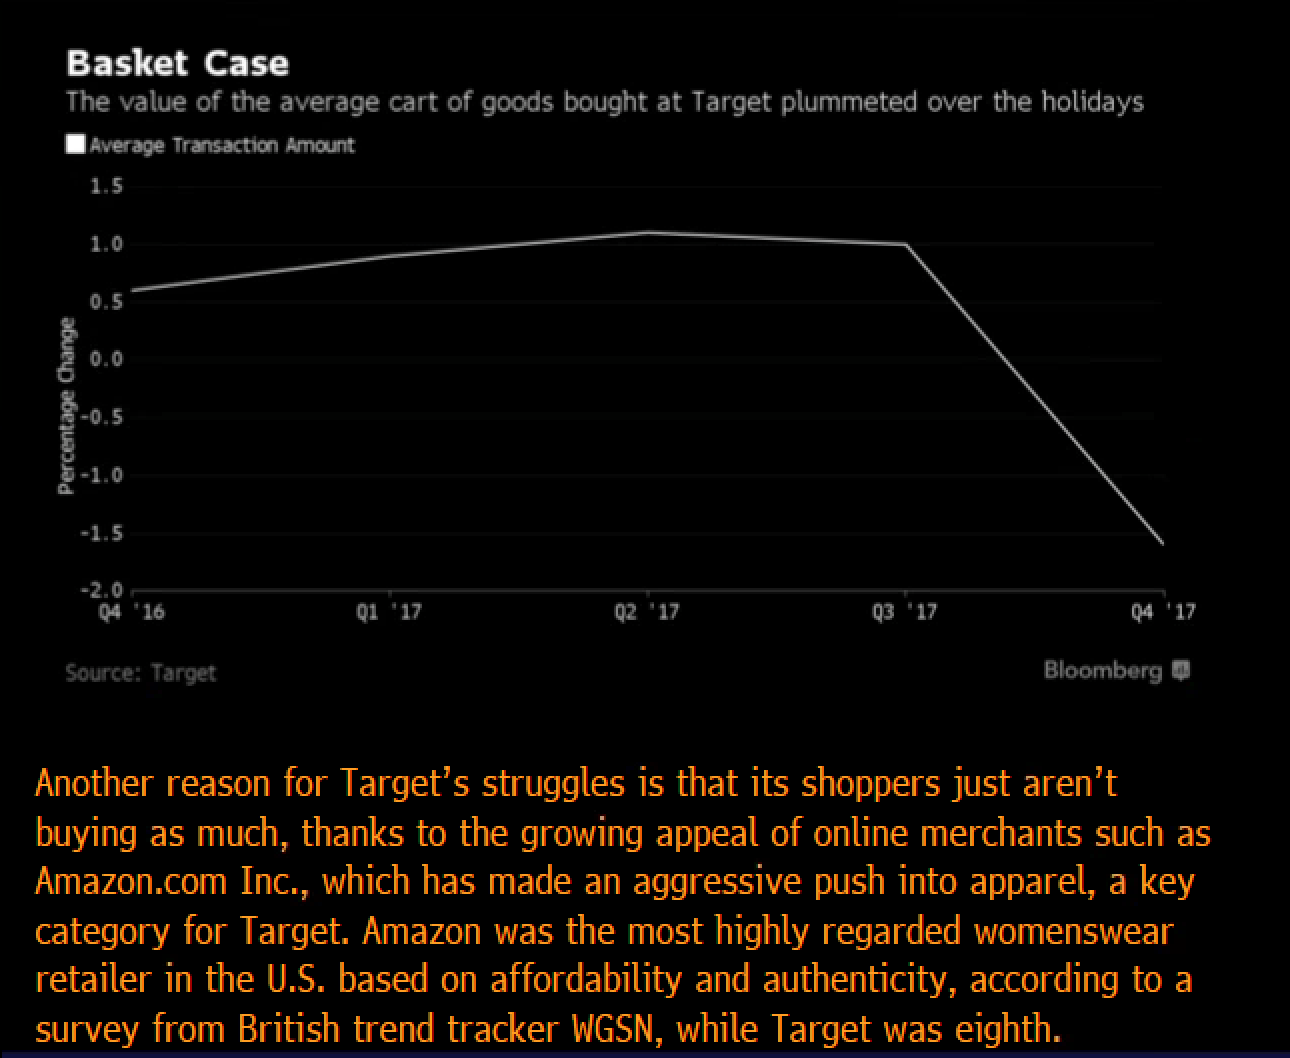
and then this, the average transaction amount at TGT declined bigly in the Holiday quarter, citing one study suggesting Amazon’s (AMZN) success in womenswear.

SO its not just WMT, and its not just AMZN, but its the slamming together of big box dominance and what will be the massive push of bricks and mortars retailers spending tons of cash to create omnichannel selling strategies. TGT will be forced to make either a huge acquisition or massive investments in infrastructure in 2017.
Despite an expected low single digits sales decline in fiscal 2018, analysts expect TGT earnings to drop 20%, likely having to do with pricing pressures and expected investments. I think it is safe to say that the current fiscal year will be a transitional one, that might be punctuated by one more significant guide down, in order to set up for a series of beats later on in the year.
So what’s the Trade?
If you thought the stock was oversold and a lot of bad news was already in, you might consider a short dated call butterfly:
Bullish:
TGT ($54.55) Buy May 55 / 58 / 61 call butterfly for 60 cents
-Buy 1 July 55 call for 1.30
-Sell 2 July 58 calls at 40 cents each or 80 total
-Buy 1 July 61 call for 10 cents
Break-Even on May Expiration:
Profits: up to 2.40 between 55.60 and 60.40 with max gain of 2.40 at 58
Losses: up to 60 cents between 55 and 55.60 & between 60.40 and 61 with max of 60 cents above 61 and below 55.
Rationale: take advanatage of high short dated options prices targeting a move higher in line with the implied move while risking a little more than the stock price.
________________________________________________________________________
Or If I were inclined to press the short, I would only do so with defined risk, risking what I am willing to lose, but giving the trade some time to play out:
Bearish:
TGT ($54.55) Buy July 55 / 45 put spread for $2.30
-Buy 1 July 55 put for 2.55
-Sell 1 July 45 put at 25 cents
Break-Even on July Expiration:
Profits: up to 7.70 between 52.70 and 45 with max gain of 7.70 at 45 or lower.
Losses: up to 2.30 between 52.70 and 55 with max loss above.
Rationale: this trade structure is already 45 cents in the money, offering a profit potential of more than 3 to 1, not bad odds if convicted on further declines.