Nvidia (NVDA) will report their fQ1 earnings tonight after the close. The options market is implying about an 8.5% move tomorrow in either direction, which is shy to the 4 qtr average of about 13% (included a 30% move back in November), but rich to the 10 year average one-day post-earnings move of about 7%.
After gaining more than 200% last year, placing it as the best-performing stock in the S&P 500 (SPX), shares of NVDA have remained volatile, trading in a 25% range year to date, down 2% on the year, down about 13% from its 2017 and all time high made in February and up about 10% from its 2017 low made last month.
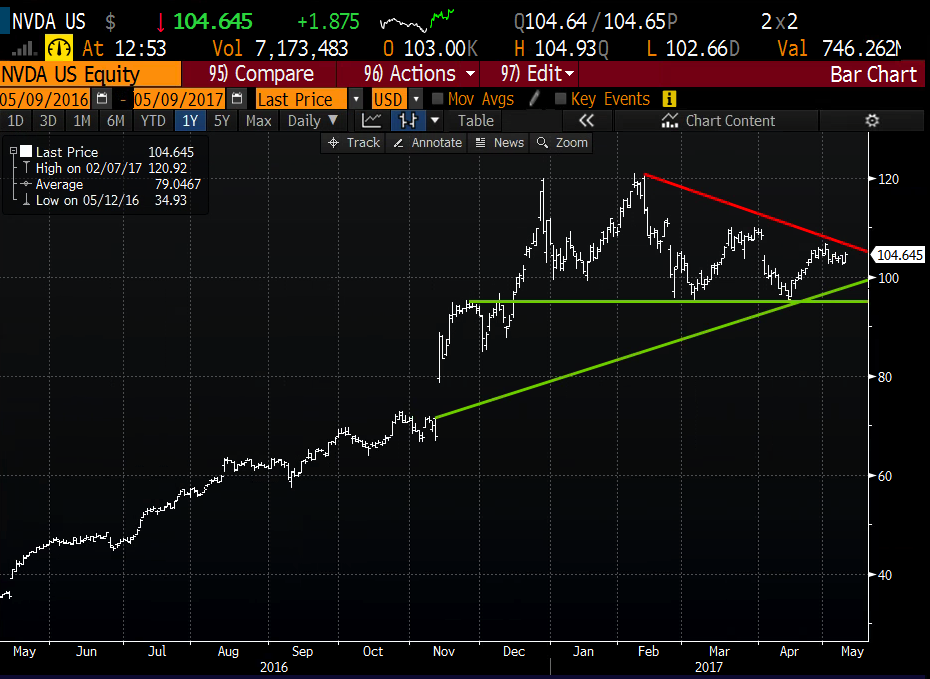
I guess there are a couple different ways you can look at the one year chart. First, since the stock made a new all-time high in February the fever has broken, and it has made a series of lower highs and lower lows. While the stock has near-term support at the December breakout level to then new all-time highs, which also happens to be the March and April 2017 lows, the stock could also be at an inflection point, as the triangle formation formed from the uptrend from the November 2016 gap 30% earnings gap converges with the downtrend from the all-time highs in February. Something’s got to give:
In 2017 investors became fairly enamored with the company’s push into emerging technologies, finding uses for their graphics chips in autonomous cars and for artificial intelligence applications, helping to spur the stock’s gains. Despite the stock’s massive 2016 outperformance, Wall Street analysts have moved to a more neutral stance on the stock with 16 Buy ratings, 12 Holds and 6 Sells, with an average 12-month price target below the prior all-time highs at $117.
NVDA trades 31x expected f2018 eps growth of 10% on and 15% yoy sales growth which is expected to decelerate from 83% and 38% respectively. With a $62 billion market cap, nearly 8x trailing 12-month sales, the stock might prove to be a challenging take-over candidate, in both size and valuation. If the company were to guide down on tonight’s call we could likely see a re-rating of the stock. The company would have to show a meaningful beat and raise to out-perform the implied move to the upside in my opinion.
But the company is reporting earnings the day before their investor day tomorrow, and I suspect management will do their best to avoid a big disappointment on the guidance front.
For those long the stock, it makes sense to protect profits.
Hedge
Hedge vs 100 Shares of NVDA (104) Buy the May12th 97/87 put spread for 1.50
- Buy 1 May12th 97 put for 1.80
- Sell 1 May12th 87 put at .30
Breakeven – Losses and gains in the stock 95.50 and up. Protected below 95.50 all the way down to 87. There is about a 19% chance of the stock being below 95.50 on the event.
Rationale – Could be paired with the sale of an upside call to make it zero cost, but that, of course, caps potential profits. In this case the ideal situation is to have the stock higher and have the hedge expire worthless for less than the gains in the stock. Worst case scenario is the stock is lower but not low enough that the hedge matters. But this type of disaster protection is a cheap way to stay in a stock that’s proved to be an enormous winner in case there’s more upside left.
For those who think the report will be better than expected, and tomorrow’s investor meeting will be bullish it might make sense for new longs to risk what they are willing to lose:
Defined Risk Bullish
NVDA (104) Buy the May12th 105/115/125 fly for 2.50
- Buy 1 May12th 105 call for 4.00
- Sell 2 May12th 115 calls at .80 (1.60 total)
- Buy 1 May12th 125 call for .10
Breakeven on May12th –
Losses of up to 2.50 below between 105 & 107.50 and between 122.50 and 125 with max loss of 2.50 below 105 and above 125.
Gains of up to 7.50 between 107.50 and 122.50 with the max gain of 7.50 at 115.
Rationale – This positions for a move higher in line with the implied move, risking 2.50 for the chance to make up to 7.50. IT’s breakeven of 107.50, higher than where the stock is trading is the cost of defining risk. There is about a 40% chance of the stock being higher than 107.50 on expiration.