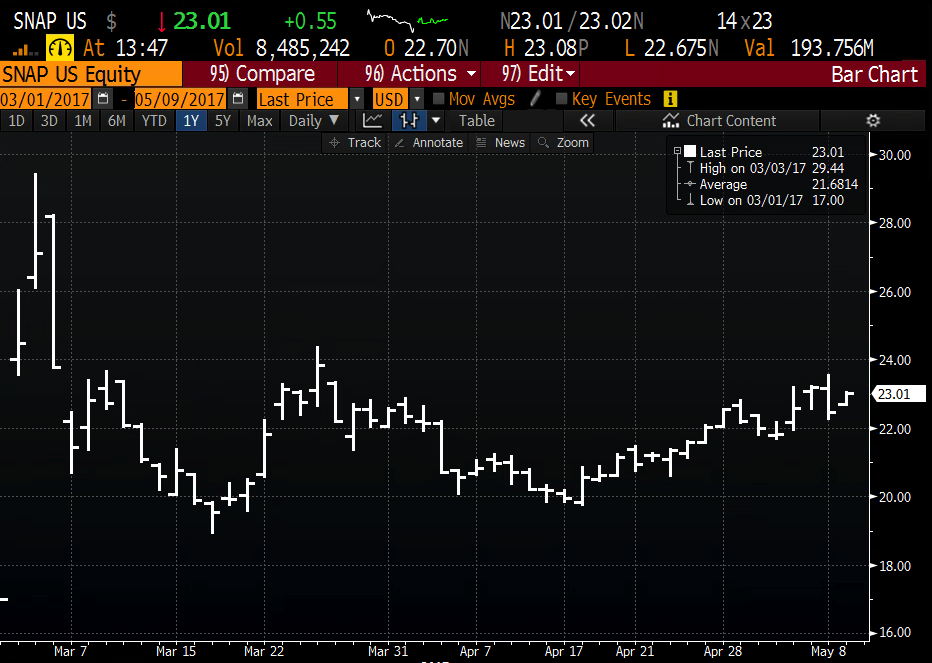
There is not too much that can be learned charting a stock that has only been trading in the public markets for a little more than two months. That is the case with SNAP. The stock’s IPO was priced at $17 on March 1st, opened at $24 up 59% on March 2nd, traded as high as $29.44 on March 3rd and has spent the better part of the last 2 months trading between $20 and $24. Not much to see here:
Tomorrow after the close the company will report their first quarterly results as a publicly traded company. The options market is implying about a 14% move in either direction between now and the end of the week (most of that is priced for Thursday’s post-earnings reaction. To figure out the implied move, (vs $23 where it is currently trading) you would take the May 12th weekly 23 straddle (the call premium + the put premium), which is offered at $3.25, and divide by the stock price. If you bought that, and thus the implied move you would need a rally above $26.25, or below $19.75, or about 14% in either direction by Friday’s close to make money
For shits and giggles I think it is worth going back and looking at the only other real high profile social media IPOs and their reaction following first earnings reports as public companies, it wasn’t pretty:
LNKD down 10% in Aug 2011
FB down 12% in July 2012
TWTR down 24% in Feb 2014
To be fair that has absolutely no predictive relevance to SNAP current situation but worth noting that despite lots of new supposed long-term investors participating in the ipos just a few months prior, there was still enough stock in what bankers call “weak hands” to send the stock materially lower on perceived disappointing results.
We will be sure to follow up with some fundamental thoughts on the stock tomorrow prior to results and offer some trade ideas for those with existing positions or have a directional inclination.