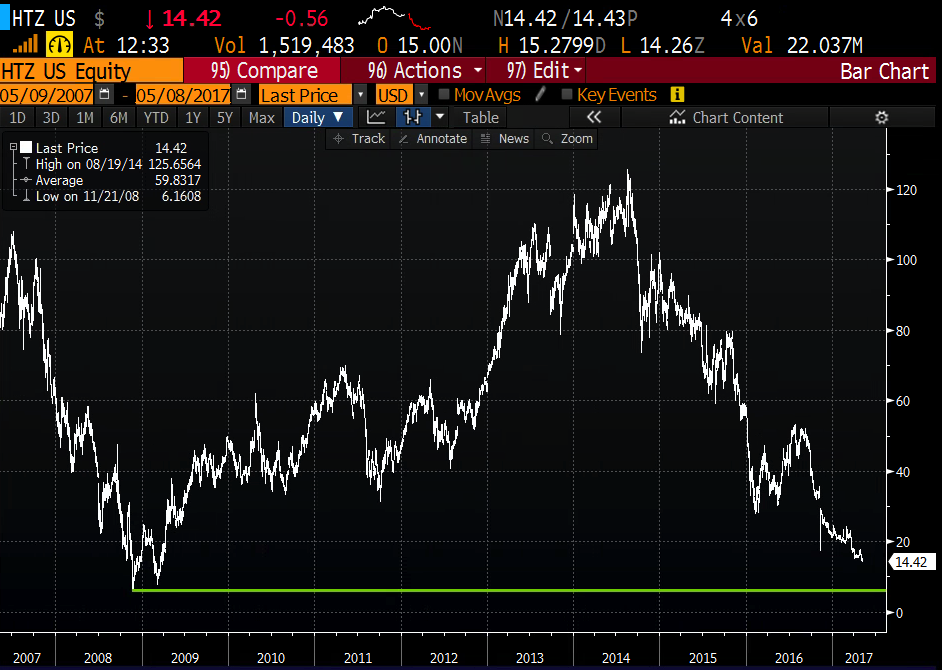
Shares of Hertz (HTZ) are making new 52 week lows today, with the stock down 33% on the year, and down a whopping 73% from its 52-week highs made last July. What’s amazing is that the stock appears to be making a beeline to the all-time lows the stock made in the throes of the financial crisis in late 2008 (the stock is still up 100% from those levels):
This price action comes a week after competitor Avis’s (CAR) miss and guide down,.
HTZ’s reports Q1 tomorrow morning before the open. The options market is implying a 12% one day move tomorrow, which is basically in line with their average post-earnings move over the last 4 quarters.
As the stock has plunged to a $1.2 billion market capitalization vs its $12.5 billion in net debt, the equity is becoming a tad distressed. Sentiment in the stock is horrid with Wall Street analysts on the sidelines with only 2 buy ratings, 8 holds and 2 sells and short interest at 40% of the float.
The stock is obviously in a death spiral, and the options market has taken note, with 30 day at the money implied volatility is at new 52 week highs:
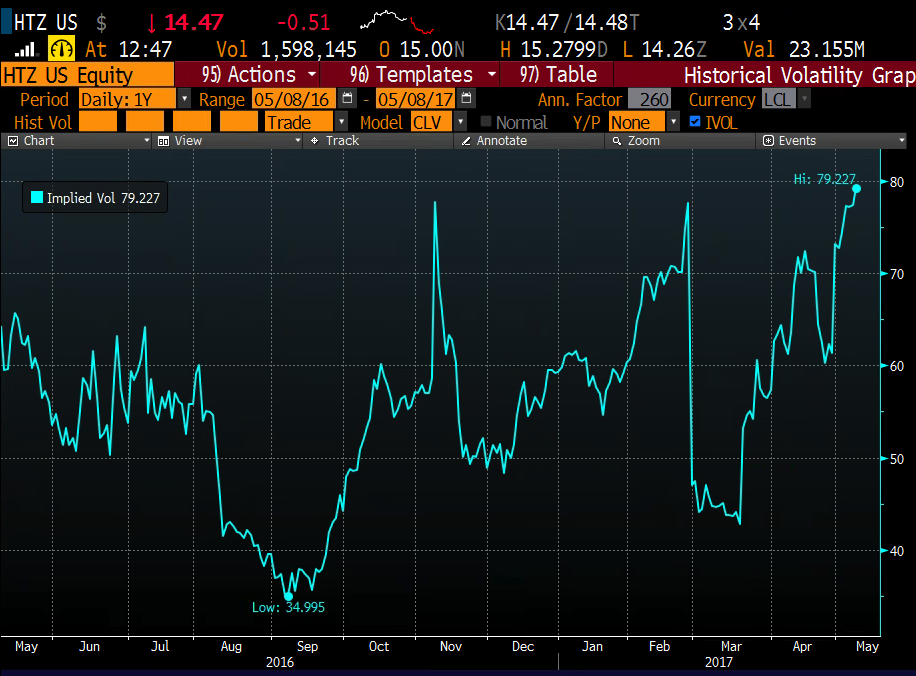
That means long premium directional strategies are nearly impossible to stomach, and that goes for hedges too. But looking for the stock to hit those previous lows is possible on a ratio (with a much different risk profile than a put of a put spread). I’ll explain its unique profile:
For instance with the stock at $14.50, you could look out to Jan18 expiration and buy the Jan 10 / 7.5 1×2 put spread for 10 cents, buying 1 Jan 10 put for 1.10, selling two Jan 7.50 puts at 50 cents each or 10 total. Here’s how that works:
If the stock is above $10 on Jan18 expiration you would lose the 10 cents paid for the spread, essentially like nothing down. BUT, If the stock is between 10 and 7.50 you could make up to 2.40 (the width of the spread less the 10 cents premium paid). If the stock is below 7.50, profits lessen and you are put the stock but at an effective price of $5.10. Well below where the stock is currently and an effective price well below the financial crisis lows. The worst case scenario is that the stock is between 5 and zero and you lose like stock. But anything above 5.10 up to 9.90 and the trade is profitable Of course, a zero is a distinct possibility for the equity of HTZ, but with Carl Icahn the largest holder at nearly 30% of the shares outstanding, I suspect his team has some sort plan B or C that would avoid the equity value of the stock being totally wiped out.
On the flip-side:
If you thought sentiment is too poor near term, and the stock might pop on anything short of a disaster you might consider a call calendar, selling a near dated call at the implied move taking advantage of the high levels of implied volatility and using the proceeds to help finance a longer dated call if you thought that much of the bad news is priced into the stock.
For instance, with the stock at $14.50, you could sell the May 17.50 call at 25 cents and buy the July 17.50 call for 75 cents, resulting in a 50 cent debit. The worst case scenario is that the stock moves significantly lower (or well above the 17.50 strike) on May expiration and you would have losses up to the 50 cents paid, but that’s the most that can be lost. And unless the July call is worthless with a big move lower, it’s unlikely to even lose the entire 50 cents and even if it was nearly worthless, you would not sell it as it would be a lotto ticket. The best case scenario is the stock goes towards 17.50, the May call expires worthless and then you own the July 17.50 call for just 50 cents in a stock that would have a ton of room to run if it saw any kind of positive sentiment change.