AT&T (T) reports their Q1 results tonight after the close. The options market is implying am 88 cent move between now and this Friday’s close or about 2.2% in either direction (most of that implied movement is for tomorrow’s earnings reaction). The stock on average has only moved about 1.4% the day following the last four quarterly reports, which is a tad shy of the 1.75% average over the last ten years.
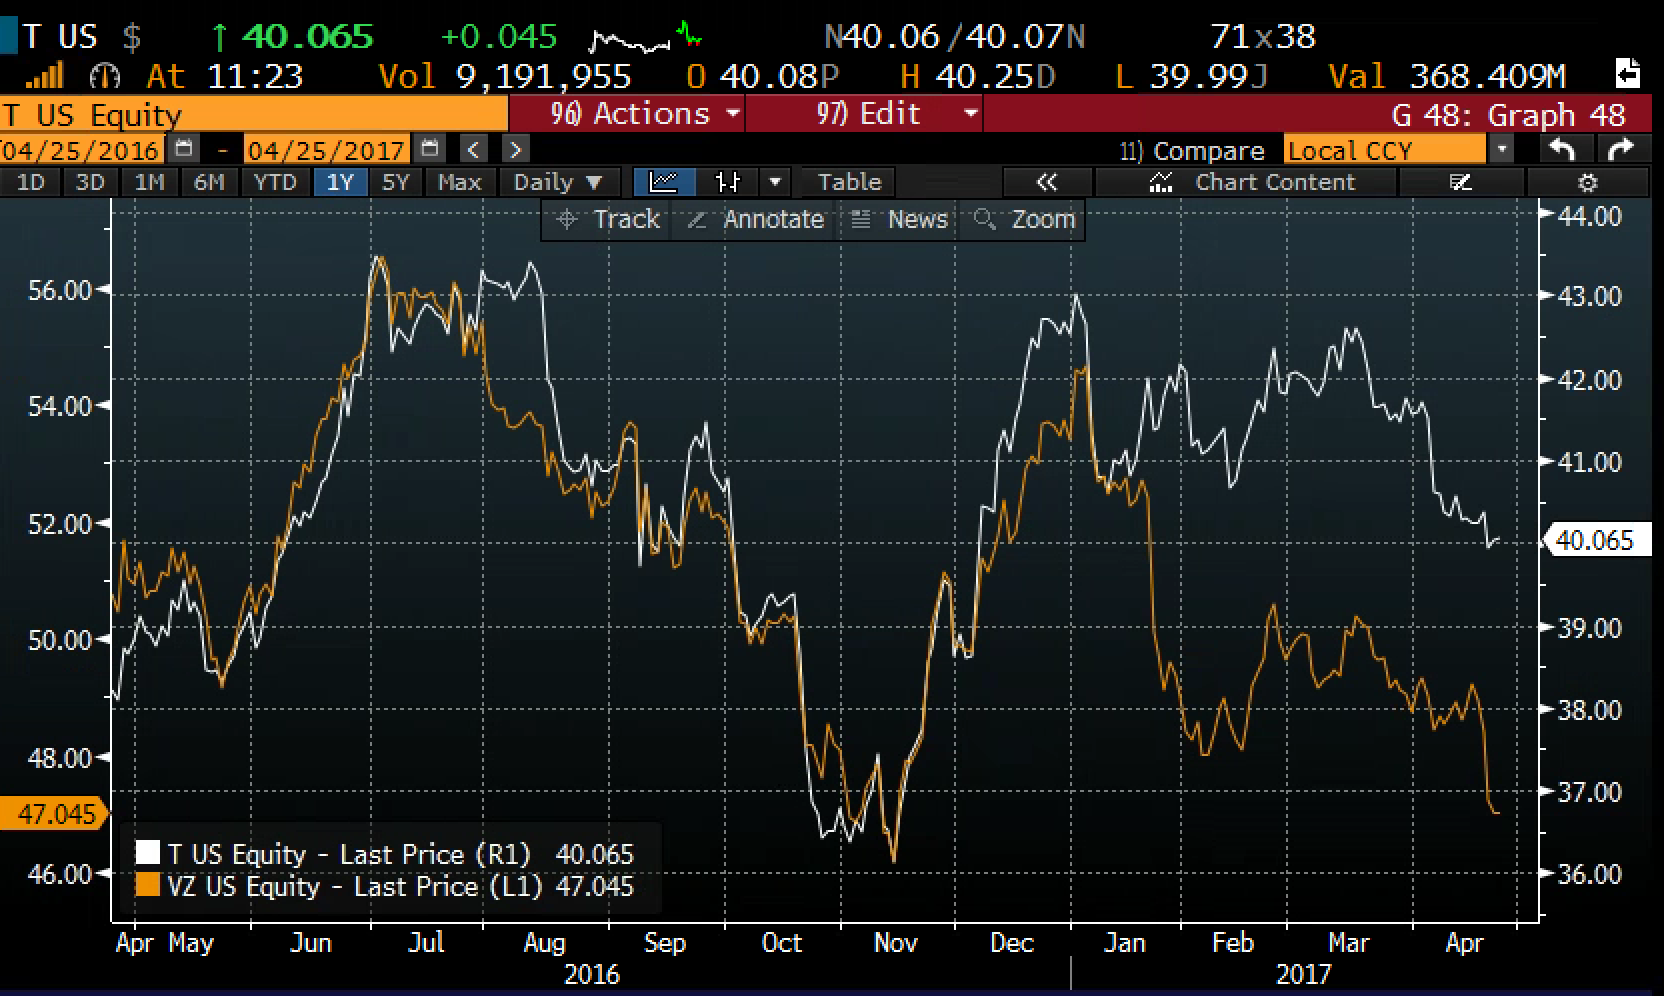
Shares of T are down nearly 6% in 2017, and down nearly 9% from its 52-week highs made last July, which is far less bad than Verizon’s (VZ) 12% ytd declines and 17% from its 52-week highs made last July. T is more than 10% from its 52-week lows made in November, while VZ is hovering just 2% above them. It’s fairly interesting how the comparison of these two charts over the last year shows a fundamental shift in their fortunes in late January. Both stocks had very closely tracked one another until VZ’s Q4 report in late Jan that saw the shares drop more than 4% the day after as the company’s profit margins were hurt by promotional efforts to maintain wireless subscribers. Then last week the company issued what some analysts viewed as disastrous showing greater than expected postpaid subscriber losses of 307,000.
It appears that AT&T investors are taking a bit of a wait and see mode as regulators consider their $85 billion bid for Time Warner (TWX) announced in the fall and the implications the vertical integration with cable (DirectTv) and content may have to stem adverse pricing trends their core wireless business.
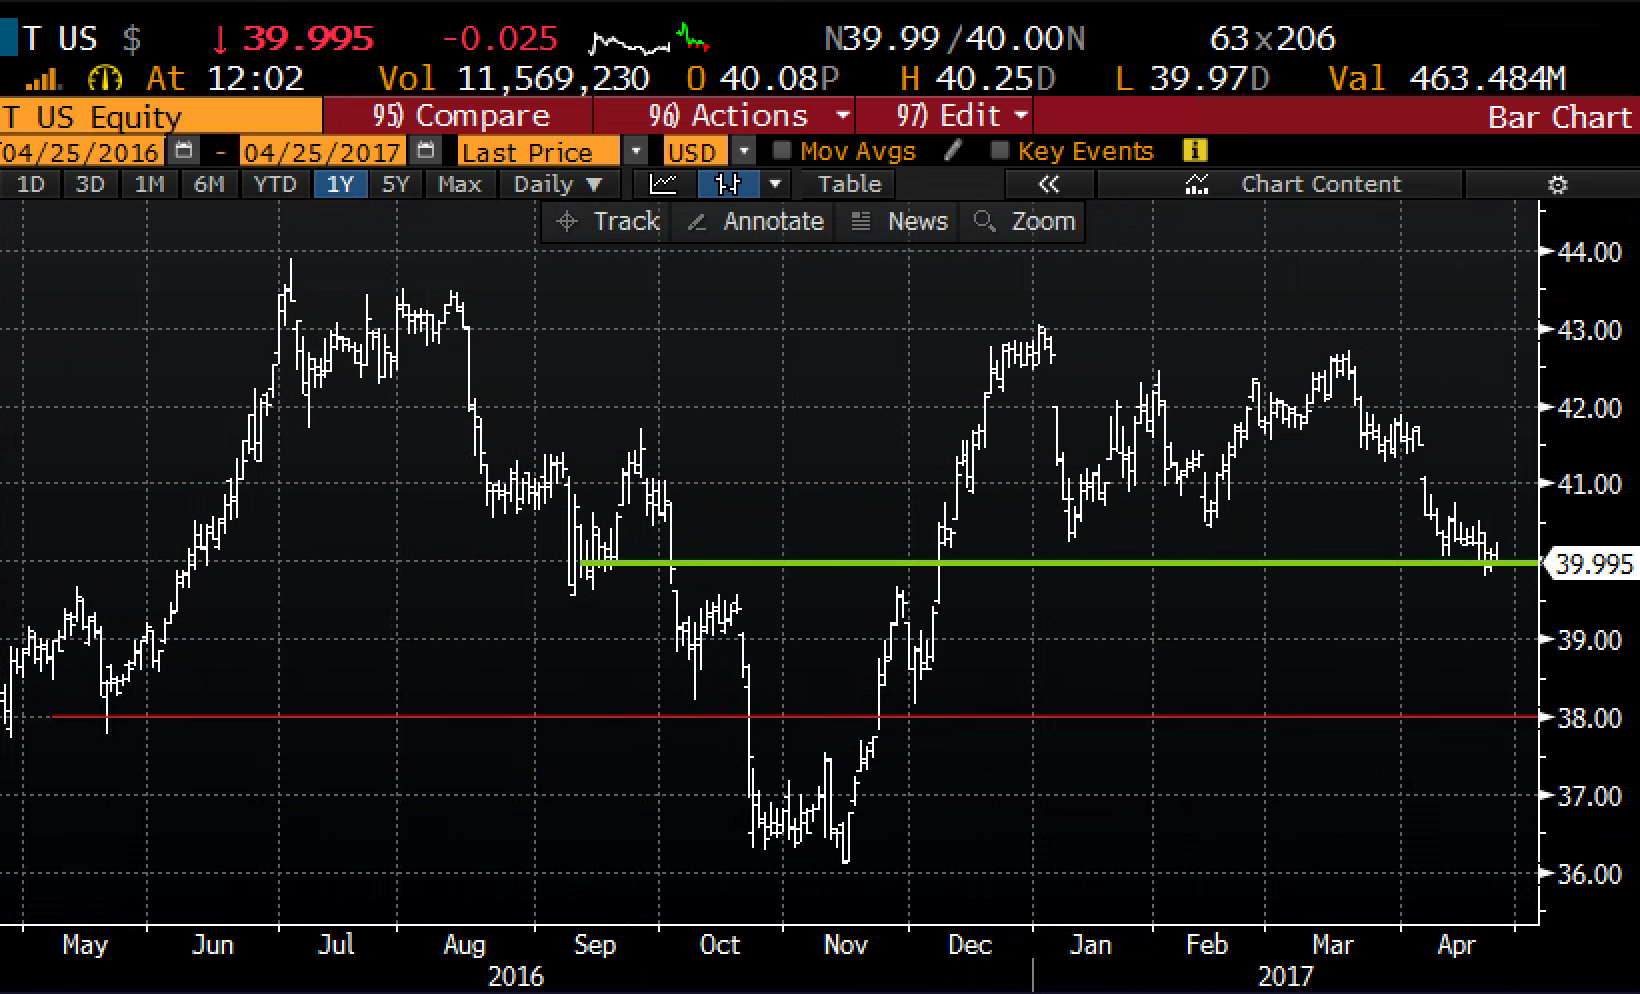
If AT&T (T) wireless margins and subs are worse than expected might investors shoot first and ask questions later? Possibly. The stock’s 4.9% dividend yield is obviously attractive to many, coupled with the prospects of TWX deal approval at some point this year. In the mean time, long holders of T might consider near-term downside protection. To my eye, given the fundamental trends, and uncertainty about TWX, $40 could prove to be precarious technical support, with immediate risk towards $38:
For hedging it’s best to keep it simple and inexpensive, guarding against any near term moves to or below 38. The April 39 puts for .15 fit that bill as a disaster hedge at a low cost. They won’t protect against a small move lower but any move towards 38 or below and they’ll provide a 1 to 1 cover for long stock.
Hedge vs 100 shares T (40)
Buy the April 28th 39 puts for .15
Now let’s look the other way for long holders and see if there’s any opportunity for low cost leverage. A place where the stock is likely to find resistance is in the 42 to 43 range. One way to add low cost leverage into that area if the stock were to rise is a 1×2 call spread vs the long stock:
Leverage vs 100 shares T (40)
Buy the May 40.50/42 1×2 call spread for .24
- Buy 1 May 40.50 call for .40
- Sell 2 May 42 calls at .08 (.16 total)
For .24 this adds up to 1.26 in leverage if the stock is above 40.50 and below 42 on May expiration. If the stock is above 42 it’s like being called away in the stock at an effective sale price of 43.50.