At the beginning of every earnings preview, we include something along the lines of this sentence (from the MSFT preview earlier):
The options market is currently implying about a 3.5% move in either direction
I wanted to dive a little deeper into implied moves and what it all means from and investing, trading and risk/reward standpoint. (For more on volatility and premium into and out of earnings see previous installments in this series here and here.)
First, what are we talking about when we say the options market is implying a move? Simply, with implied volatility as the main variable, the implied move is the percentage move the at the money straddle (the call premium + the put premium of the same strike and expiration) is pricing as a breakeven for those buying and selling options into the earnings event. Implied volatility is the main variable because it will rise (and the price of the straddle itself) as traders and investors pay up for options (expressing uncertainty), and it will fall (and the price of the straddle itself) when uncertainty and fear subside.
Earlier today in the Big Printin’ post on Microsoft (MSFT), we highlighted the breakeven of the at the money straddle:
With the stock at $67.40, the April 28th weekly 67.50 straddle (the call premium + the put premium) is offered at $2.50, if you bought that and thus the implied movement for the week (which is mostly for the earnings event), you would need a rally above $70, or a decline below $65 on Friday to make money.
Easy enough. And we also compared how the current implied move compared with the actual realized move in the stock following earnings, over the past year, and over the past 10 years:
The options market is currently implying about a 3.5% move in either direction, which is shy to the 4.7% average one-day post-earnings move over the last 4 quarters and below the 10-year average one-day post earnings move of 4.5%.
That gives a sense how this event’s implied vol (and therefore implied move) compares to past events.
Now let’s dive deeper. One of the mistakes people make when talking implied moves is confusing it with an expected move. We don’t expect MSFT to move 2.50 in either direction. That’s just one of the possibilities. Other possibilities are that the stock moves $10, or that it doesn’t move at all. When confusing an implied move, which is simply the point at which the options market has established as the breakeven to buy or sell the straddle, as an expected move, we make it seem like the stock is either going to move up by 2.50 or down by 2.50. Two 50% probabilities. But that is wrong.
The options market already has a better way to explain and it involves deltas. Deltas serve a yeoman’s role in options pricing. They tell us the rate of change of an option versus the move in the underlying (if a call has 50 deltas and the stock goes up by 1.00, the call will increase in value by roughly .50). They also tell us the hedge ratio of stock versus options and the equivalent underlying position (stock has 100 deltas, which means buying two 50 delta puts for every 100 shares of long stock is delta neutral). The final thing they can tell us (which is the most important here) is an approximation of the probability of the stock moving above or below that corresponding strike (in other words, the probability of that put or call finishing in the money).
As an example, if a 5 dollar out of the money call is 10 deltas, the options market is telling us there is roughly a 10% chance that the stock is higher by $5 on that expiration.
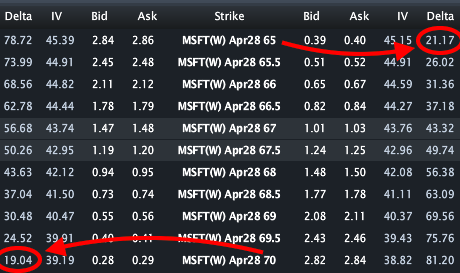
So going back to our straddle example in MSFT, the options market is implying a move of just under 2.50 in either direction. And with the stock near 67.50, that means the break-evens on either side are roughly 65 and 70. Looking at the 65 puts and the 70 calls, we see deltas of about 20, meaning about a 20% chance of a move beyond those points by Friday expiration, according to the options market:
And the at the money options are 50 deltas. What that means is there’s a 50% chance of the stock moving up, and a 50% chance of the stock moving down. And a roughly 50% chance it barely moves at all!
All of these probabilities mix together to form a collective assumption on break-evens and the risk/reward of buying and selling options into an uncertain event. Because supply and demand of the options themselves dictate the pricing, moves can become self-fulfilling prophesies that often stop on a dime near the implied move. Why that happens is a topic for another post…