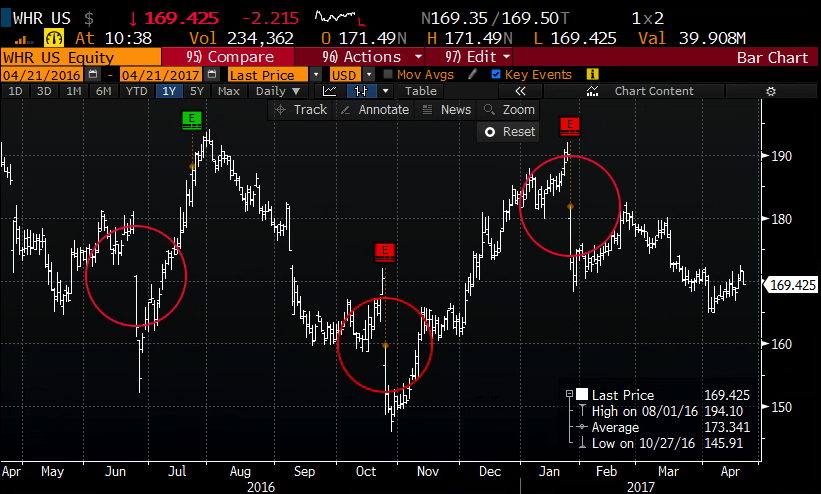
Whirlpool (WHR) has been a gappy stock over the past year, with the stock dropping 8.5% and 10.8% following its last two earnings reports in (Jan and Oct respectively) with an early September gap on cautious analyst commentary and a 10% gap in late June following the surprise Brexit vote. What’s clear from the one year chart, this stock takes the escalator up and the elevator down, there are NO gaps higher during this period:
The company is scheduled to report its Q1 results after the close this coming Monday, the options market is implying about a 5.3% one day move in either direction, which is a little shy of the 6.3% average on day move over the last 4 quarters, but basically in line with the 5 year average.
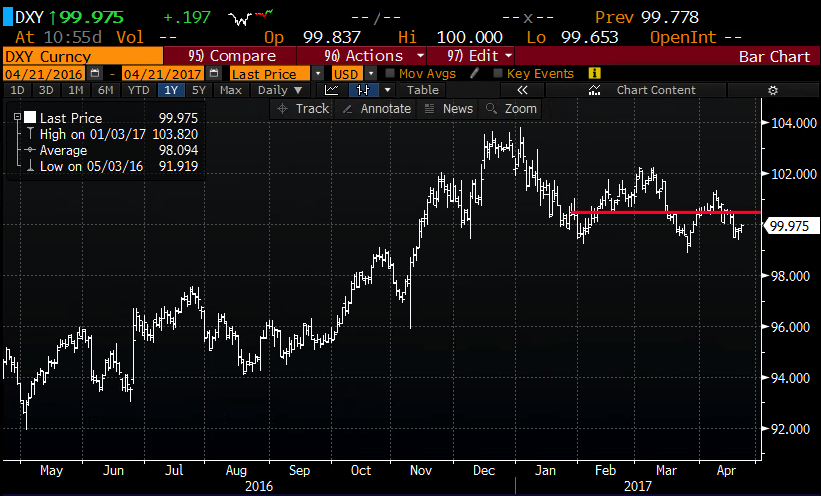
WHR is a U.S. based company that gets nearly 55% of their sales from overseas, the rising dollar in the second half of 2016 (the DXY, US dollar index) went from a low of $92 post-Brexit to a 14 year high just below $104. With the DXY at $100 or so, this might help buoy WHR’s guidance, down nearly 4% from the early January highs, but its only 40 bps or so below where it was when WHR guided for Q1 on Jan 26th:
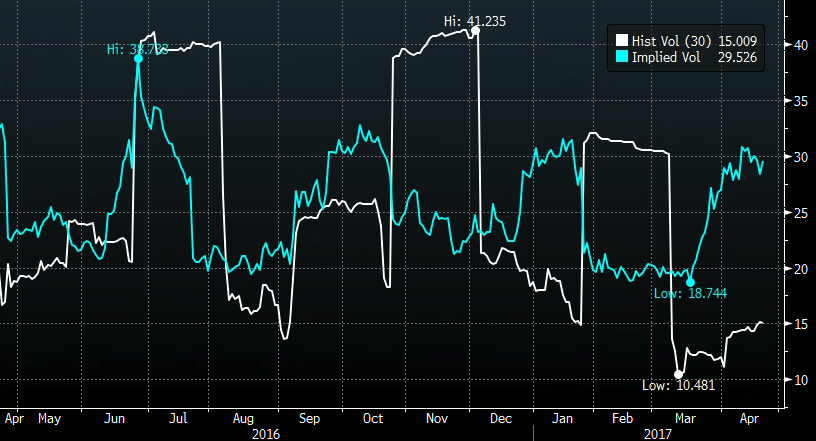
For a $12.6 billion market cap stock, WHR does not have a ton of options open interest, about 39,000 options total, with a seemingly small notional value on a relative basis. Yet the spread between 30 day at the money implied volatility (the price of options, blue below) vs the 30 day realized volatility (how much the stock is moving, white below) is quite high, making options prices very expensive into the print for those looking to make a directional bet or to buy protection:
If I were inclined to play for a gap lower, I might target $160, which would be a tad above the implied move lower, but look to use a put butterfly to help offset the cost of options. For instance, with the stock just above $170 you could:
Buy the WHR ($170.50) April 28th weekly 170/160/150 put butterfly for ~ $1.50
-Buy 1 Apr28th 170 put for $4.50
-Sell 2 Apr28th 160 puts at $1.60 each or $3.20 total
-Buy 1 Apr28th 150 put for 30 cents
Break-Even on Apr28th (next Friday):
Profits: up to 8.50 between 168.50 and 151.50, with max gain of 1.50 at 160
Losses of up to 1.50 between 168.50 and 170 & between 150 and 151.50 with max loss of 1.50 above 170 or below 150
Rationale: If you were inclined to play for a gap lower in line with the implied move, this trade idea defines risk to less than 1% of the stock price, while offering a potential profit of more than 5x what is at risk. If you thought the stock could decline greater than the implied move, but the trade structure makes sense then you might consider widening the strikes, like 170 / 155 / 140, which would cost more, but offers a greater potential payout.
Disclaimer: As always, to commit to a long premium pre-earnings trade, one needs to have conviction on the idea, as you need to get a lot of things right to just break-even, like direction and then magnitude of the move. And with expiration next Friday, it risks a total loss. The best way to look at this trade is as a defined risk short. The tradeoff for having that defined risk (just 1.50 to make up to 8.50) is the breakeven on the trade is $3 lower than where the stock is currently trading.