From late September to early December, shares of Anheuser-Busch (BUD) had a peak to trough decline of nearly 30% from an all-time high. What’s interesting about the chart below since Jan 2016, the high came on the eve of the closing of BUD’s $100 billion takeover of competitor SAB-Miller, while the low came when the U.S. dollar was at 13-year highs, which is important because the company gets two-thirds of their sales from overseas. The stock has since recovered a bit, up about 10% from the lows, making a series of higher lows and high higher highs, but at $110 at an important technical resistance level, early 2016 low, and the late 2016 breakdown level:
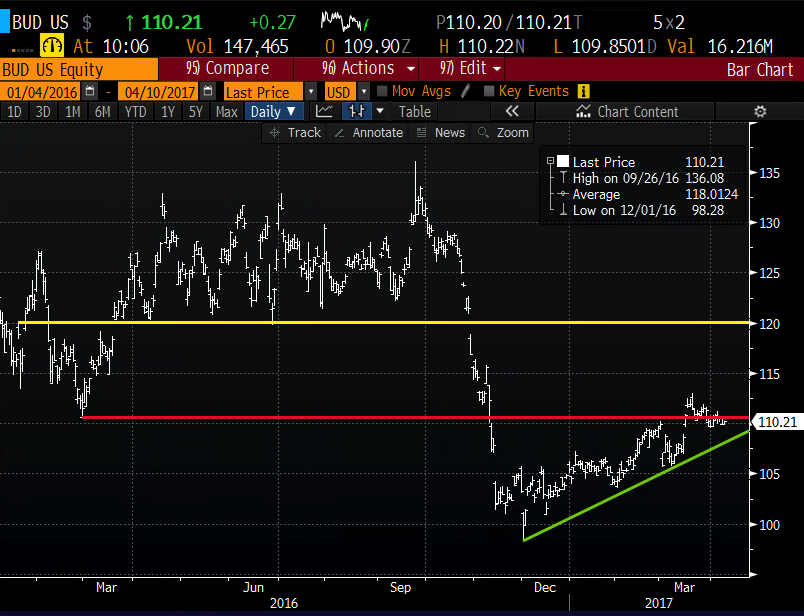
There appears to be an airpocket from $110 to $120, the November breakdown level.
So here is the thing, the newly combined beer behemoth, has a pile of debt, $123 billion to their $223 billion equity market capitalization and $14 billion in cash. To put that in some context, Coca-Cola (KO) which sports a market cap of $183 billion, has $46 billion in debt and $22 billion in cash.
Comparisons aside, the new and improved BUD is expected to book $56 billion in sales in 2017 and trades at 24x expected EPS of $4.53. The year over year growth rate does not matter much considering the combination, but with a 3% dividend yield, and the promise of significant cost savings which will pay down debt.
The next identifiable catalyst for the stock will come on May 4th when they report Q1 earnings. The options market is implying about a 4% one-day post-earnings move, which is basically in line with the average over the last 4 quarters, but rich to the 10 year average of 2.4%.
If I were inclined to play for a near-term bounce back to $120, and think Q1 earnings might serve as the catalyst, I might consider near the money call spreads. With the stock at $110.50 the June 110 / 120 call spread is offered at about $2.85. This trade would break-even at $112.85, offers a max potential gain of $7.15. This call spread is already 50 cents in the money and offers a very reasonable risk reward. The premium at risk can be further reduced by selling downside puts. The June 105 puts can be sold at 2.50 which would mean the entire trade is only risking .45 if the stock is between 105 and 110 on June expiration, it can make up to 9.55 above 110 and you, of course, would need to willing to be put the stock below 105. And that risk of being put the stock can be defined by adding a fourth leg and buying the June 100 put, creating a put spread/ call spread risk reversal. Here’s what that position looks like, it’s less complicated than it seems:
Long Stock Alternative
BUD ($110.50)
Sell June 105/100 put spread at $1.20
- Sell 1 June 105 put at 2.50
- Buy 1 June 100 put for 1.30
Buy June 110/120 call spread for 2.85
- Buy 1 June 110 call for 3.70
- Sell 1 June 120 call at .85
Breakeven on June expiration:
Losses of up to 1.65 between 105 and 110. Losses of up to 6.65 below 105 with losses of up to 6.65 below 105 with max loss of 6.65 at or below 100.
Gains of up to 8.35 above 110 with max gain of 8.35 above 120.
Rationale – This is asymmetrical risk reward in two ways when compared to stock. For a slightly higher breakeven on the stock (about a dollar higher than where stock is now) you can:
1 – Define risk to less than what is possible in gains if the stock goes higher (6.65 risk, 8.35 reward)
2 – Losses like stock don’t begin until more than $5 lower in the stock, where gains begin at the breakeven about a dollar higher. (breakeven 110.65, only 1.65 at risk between current stock price and the short 105 put).