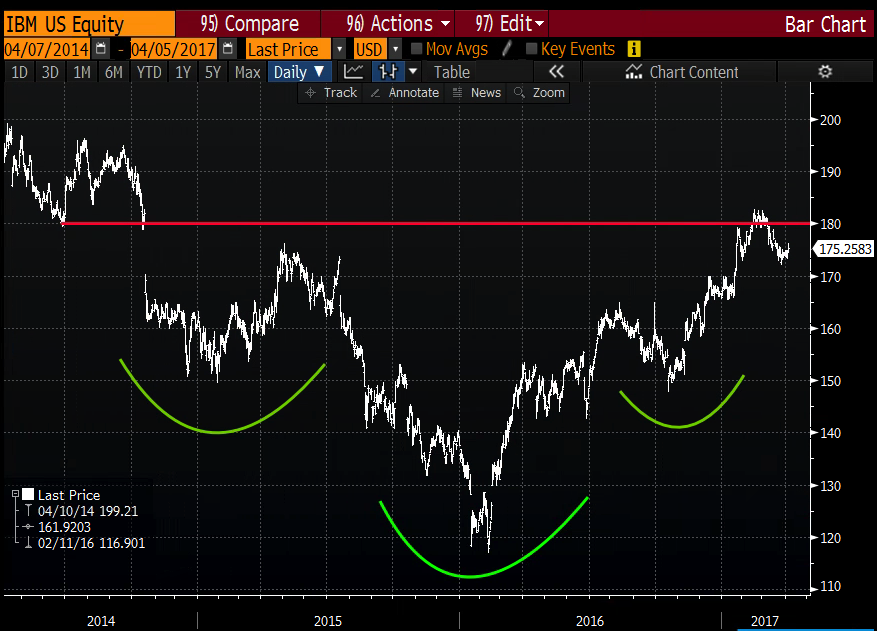
Taking a quick gander at the 3-year chart of IBM and once can see what appears to be a fairly textbook head and shoulders bottom formation, with $180 serving as the neckline (aka technical resistance):

IBM is scheduled to report Q1 earnings in less than two weeks on April 18th after the close. The options market is implying about a 3.5% move between now and April 21st expiration, about $6.15 in either direction. Most of the implied move is obviously for the earnings event, which is above the average one-day post-earnings move over the last 4 quarters of about 2.5%, and a tad below the 10 year average one day post earnings move of 3.6%.
The stock hit my radar today as there are appeared to be a decent size bullish roll in the stock shortly after the open. When the stock was trading $176.28, a trader sold to close 10,000 July 195 calls at 78 cents, and bought to open 10,000 Oct 195 calls for $2.12. This new call position break-evens at $197.12, up almost 12% from current levels.
While we like to highlight unusual options activity, we do no pretend to suggest that we know a trader’s intent, and without intimate knowledge of the trade it makes little sense to extrapolate such activity for one’s own trading purposes. For instance, while this call calendar was reported as bought, that is sometimes wrong. It could have been sold, meaning that the trader was buying to close the July calls, and selling to open the Oct calls. If this was the case, it’s possible the trader was rolling an out of the money overwrite of a long stock position. And if that is true, selling a nearly 12% out of the money call over the course of 3 months to take in a little more than 1% added yield might make a lot of sense when you consider annualizing that yield on top of their already 3.2% dividend yield.
So while the trade was reported as bought, it might have been the other way around, and at this point I was happy to see the trade as it got me looking at the technical set up and the next identifiable catalyst. Also Bernstein Research analyst Toni Sacconaghi had a note out today on the stock, per Barron’s Online, suggesting the stock’s out-performance was not the result of all those flashy Watson commercials, and the company’s marketing focus on AI, but:
“Many believe that IBM’s outperformance has been driven by increasing investor appreciation for Watson and the company’s vision of becoming a cognitive solutions and cloud company.”
“We believe that much (perhaps all?) of IBM’s outperformance last year can be explained by two market-related (i.e., not fundamental factors). These factors are (1) a thirst for yield, and (2) a migration to passive.”
Sacconaghi notes IBM is among the cohort of high-yielding names that as a group beat the S&P in a year of uncertainty:
Against a backdrop of falling rates and macroeconomic uncertainty for much of the year, 2016 was a market in which value stocks meaningfully outperformed growth stocks and more importantly high yield stocks outperformed dramatically. Our analysis indicates that the top yield quintile (i.e., highest dividend yield stocks) outperformed the bottom quintile (lowest dividend yield stocks) by 1310 bps; moreover, within the technology sector, the pattern was even more pronounced, with the highest quintile dividend payers outperforming by 1540 bps. » Even more stunning is the fact that the top 25 highest yielding technology stocks outperformed the market by an average of over 1800 bps in 2016, with 22 out of those 25 stocks outperforming (hit rate = 88%). Among the highest dividend tech payers was IBM (ranked #8 on our list) – IBM outperformed by 1280 bps, lagging the average relative performance of the top 25. In essence, IBM was in the red-hot sector of the market last year, but against its high dividend tech peers, it actually modestly underperformed.
We’ve spoken a bunch about passive and algo driven investing recently (here, here). This is another interesting data point.