On February 17th we detailed a bearish strategy in the etf that tracks the S&P 500, the SPY (SPDR Senses Tingling), when the SPY was trading very near where it is at the moment. Here was the trade idea and rationale:
BUY – SPY ($234.70) MAY 230 / 210 PUT SPREAD FOR $2.75
-Buy 1 SPY May 230 put for $3.80
-Sell 1 SPY May 210 put at $1.05
Rationale – Again, no one knows when this current low vol rally will come to an end. But it’s unlikely historically to continue for the next few months. This entry could be wrong, but for those looking to hedge or take a bearish position right now, it comes at such a low cost relative to the index itself because vol is so low. If the market were to correct in any way the break-even at 227 targets the recent consolidation, essentially locking in profits below vs a portfolio. For those simply looking to fade the recent breakout, even a move back to that consolidation would garner a nice profit on the trade, and then have the opportunity for much more if it was unable to hold that level. Vol is not an issue as even on up days recently the VIX has shown signs of putting in a bottom, and string of down days and this trade will benefit from a pop in vol in addition to the short deltas.
With the SPY at $234.50 the May 230/210 put spread is worth about $2.10, so a loss of 65 cents (2.70 vs 60 cents).
At this point I think it makes sense to revisit some thoughts from our TLT post yesterday. In it we discussed the potential for equity markets to be in for a bumpier ride over the next few months:
I have no idea what to expect from today’s possible House vote on the AHCA, intended to “repeal and replace” the ACA. And your guess is as good as mine as to what ultimately happens on healthcare reform in general. But today’s vote is obviously coming down to the wire. And even once something passes the House, the Senate is a whole ‘nother story. What I do know is that the downward volatility in stocks on Tuesday was a clear sign of investor unease with any drama in Washington disrupting what it had assumed would be a “pro-growth” agenda of massive tax cuts and stimulus. The likelihood of quick tax reform, fiscal stimulus and industry de-regulation (outside of executive order) takes a hit for in the 2017 over/under everytime a new congressional battle takes center stage. And with the House right now torn between representatives who are worried voters may punish them if they repeal protections of the ACA, and those in the Freedom Caucus the Koch’s have promised to throw money behind to defend in the primaries because the bill doesn’t go far enough in removing those essential benefits, there seems to be a big chasm for the House leadership and the White House to overcome. And again, we’re not even talking about the Senate
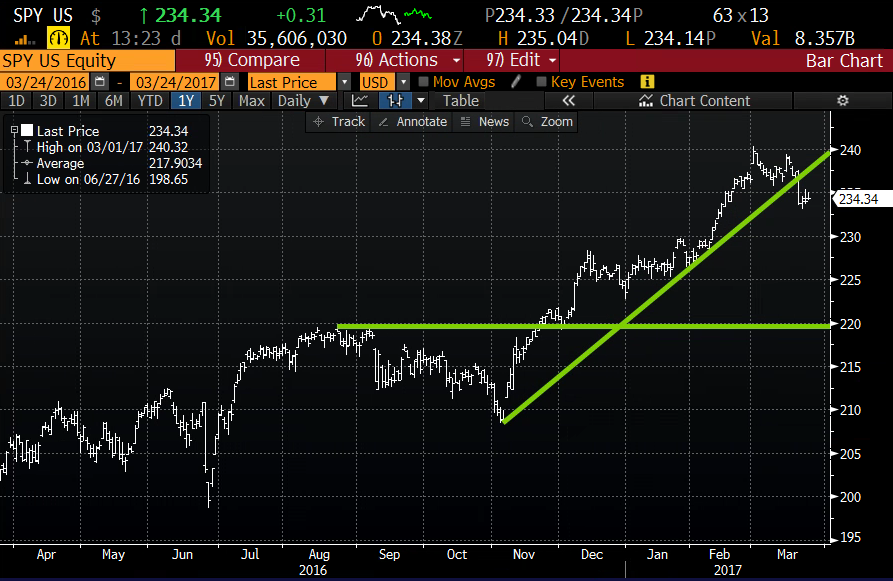
And all this is against the backdrop of a fairly new coalition of voters in the 2016 election that is not likely to see eye to eye on fiscal stimulus, and deregulation in areas like banking that are clearly at odds with the portions of the President’s populist message during the campaign. Add it all up and you get to the big one, Tax reform, which is certainly a trickier subject, and the one the market is most clearly anticipating. On Tuesday morning, the WSJ laid out the challenges for 2017 Tax reform, Why Trump’s Tax Cut May Be Later and Smaller Than Investors Think and we discussed market expectations, and positioning yesterday, in Swamp Things. This was one of the main reasons we saw volatility earlier in the week and it could be a preview of things to come as all eyes on on worth taking a look at the technical set up of the SPY, that looks very different tan it did on Feb 17th having what might have been a sentiment top following the president’s Feb 28th speech where he read a teleprompter for an hour and failed to make a single gaffe. Since then the SPY has been in a downtrend, and broken the uptrend from the November pre-election lows. This uptrend might serve as near-term technical resistance, with the next level of support at $230 – $225, the consolidation level from Dec, Jan and early Feb, and then the breakout level to new highs in late Nov of $220 as a healthy downside target:
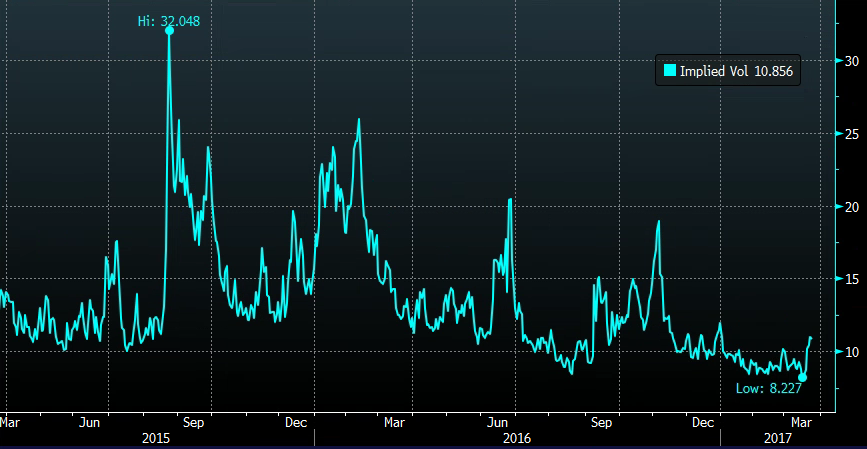
Short-dated options prices in the SPY have just spiked off of multi-year lows, with 30 day at the money implied volatility at nearly 11%, up from 8% last week, and obviously well below the lower highs over the last two years:
At this point it might make sense to roll this May put spread out to the end of Q2 while it’s a small loss and give it more time to capture any serious downside:
SPY ($234.50) Buy June 30th quarterly 230 / 210 put spread for $3
Buy 1 June 30th quarterly 230 put for 4.50
Sell 1 June 30th quarterly 210 put at 1.50
Break-even on June 30th quarterly expiration:
Profits up to 17 between 227 and 210 with max profit of 17 at 210 or below
Losses up to 3 between 227 and 230 with max loss of 3 above 230