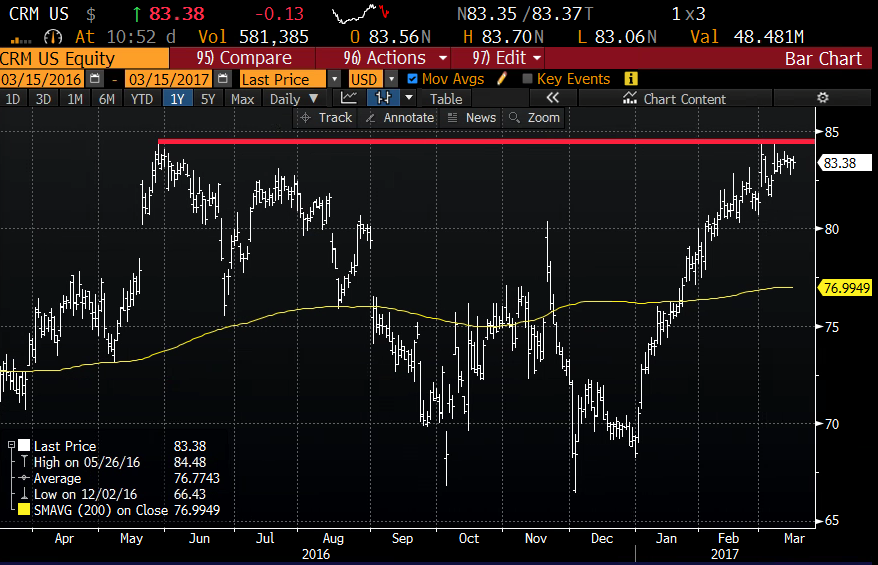
After a dismal year in 2016, closing down about 13%, shares of Salesforce.com (CRM) are up a whopping 22% so far in 2017, and now less than 2% away from its 52 week and all time highs made last May. The stock has obviously made up a lot of ground in a short period of time after making a 52 week low in early December. The stock is now threatening a breakout to new all-time highs:
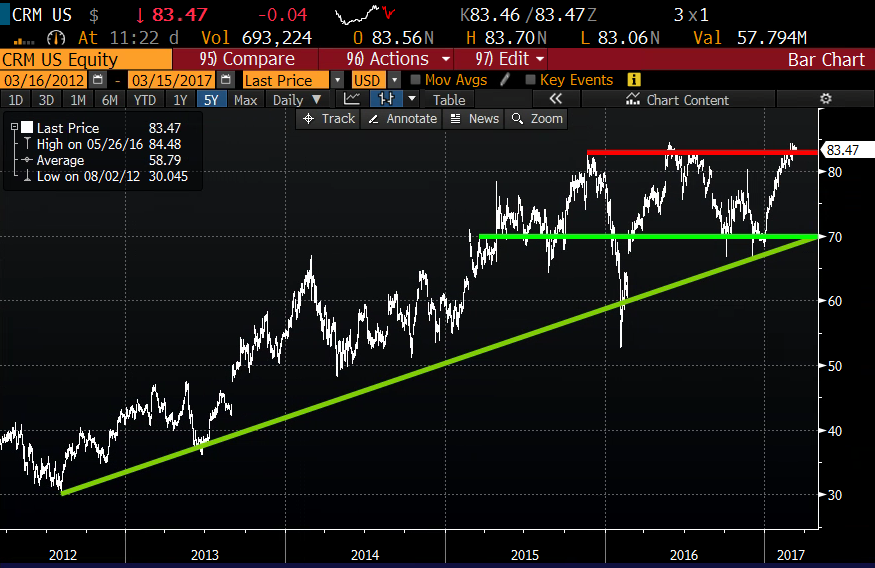
Taking a 5 year view, and drawing the lines that seem fairly obvious to me, you have a chart that is either about to fail at a prior double top (and possibly re-trace back towards the long term uptrend near $70) or break-out above what would subsequently be viewed as a two-year base between $70ish and $80ish:
Tonight after the close, competitor Oracle Corp (ORCL) will report their results, and its always fun to hear management throw shade on CRM as the two battle for cloud revenue supremacy.
The next identifiable catalyst for shares of CRM will be their fiscal Q1 results that should fall in the last week of May. With short dated options premiums nearing 52-week lows, after the stock’s sharp ytd gains, it might make sense for long holders to get a tad more defensive and consider stock replacement, with defined risk. For instance with the stock at $83.50, the May 82.50 / 95 call spread is offered at $3.60. This call spread is $1 in the money, breaks-even at $86.10, and offers max profits of $8.90 up to $95
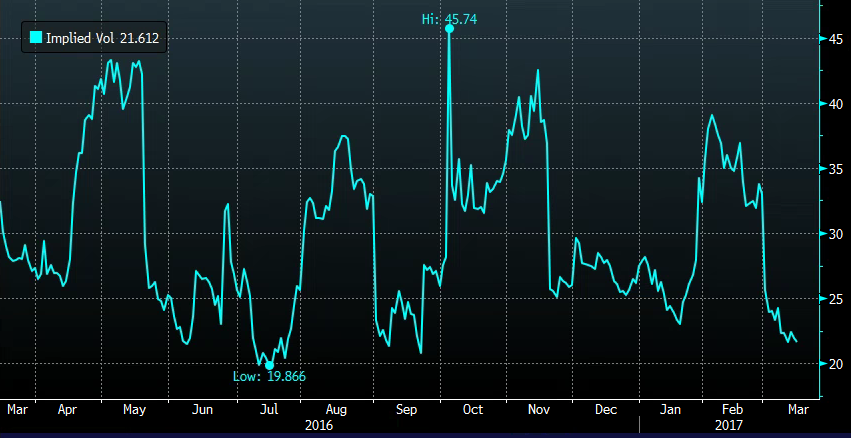
30 day at the money implied volatility is just a couple points above where it was in mid-July when the stock was last near current levels:
The other option for long holders is a hedge for a slight credit. The May 77.5/90 collar might make sense for those who want to protect against downside, but also participate on the upside:
Hedge
vs 100 shares of CRM (83.50) Buy the May 77.5/90 collar for a .15 credit
- Buy 1 May 77.5 put for 1.50
- Sell 1 May 90 call at 1.65
Breakeven on May expiration –
Gains in the stock between current levels and 90. Called away in the long stock above 90
Losses of the stock from current levels down to 77.50, but protected below.
Rationale – The collar makes sense here to protect against any failure at the highs. If the stock pull back here your shares are protected below 77.50 And with no major scheduled catalysts between now and May expiration the likelihood of a gap higher is low. Therefore even if the stock breaks out, there may be mark to market losses on the hedge (vs gains in the stock) but those will be small as vol stays low and those short 90 calls decay. The most likely scenario is you collect the .15 with the stock between the two strikes on May expiration. But if there was a serious failure in the stock here, profits in the stock are locked in 6 dollars lower, taking away most fears and allowing continued holding of a long as you look for higher highs.