Prior to Crude Oil’s two day 8% decline, the chart was likely one of the most constructive looking chart on my radar, having just consolidated for three months, in the face of a well bid U.S. dollar, after the prior 10 months making a series of higher lows and higher highs from its double bottom low in Jan/Feb 2016:
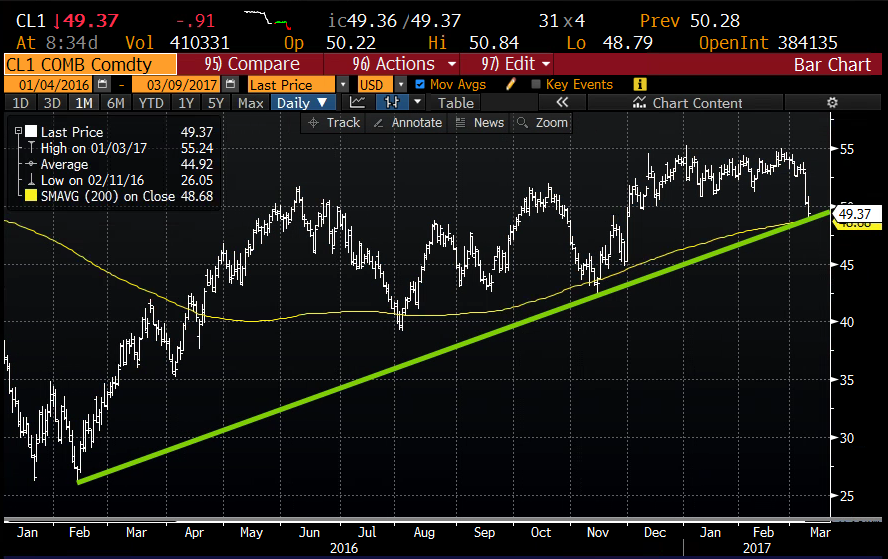
Record scratch. Now the commodity is testing a key technical level (the intersection of the 200 day moving average and the uptrend that had been on place from the lows).
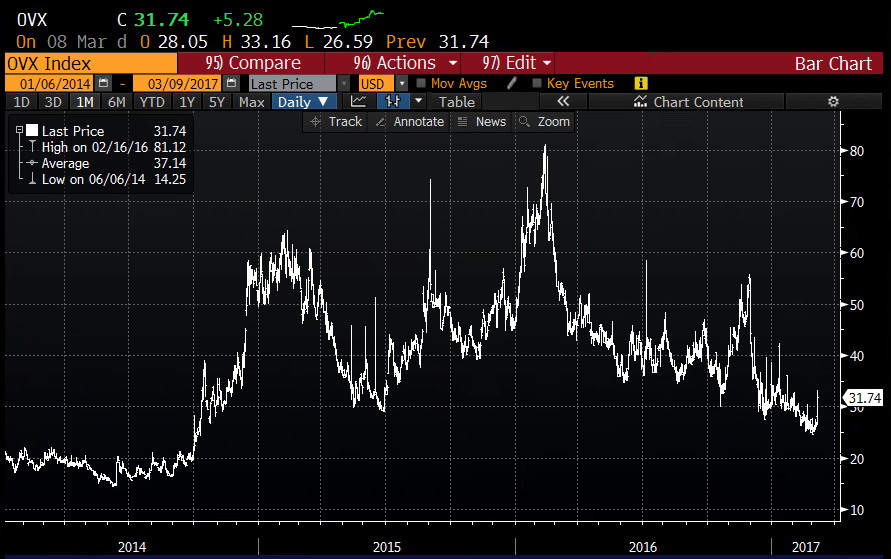
The OVX, the CBOE Crude Oil Volatility Index, had its biggest one day gain (20%) in years yesterday. But it’s worth noting that because of the lack of volatility of late in the underlying, those gains come from near 52 week lows. But they were significantly higher levels than when Crude was above $100 back in 2014 (when vol was in the teens):
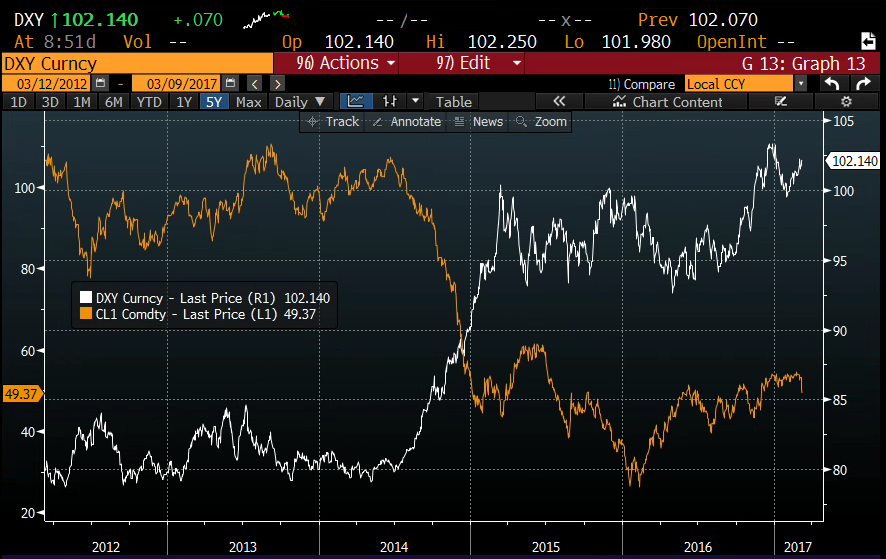
Let’s not forget why Crude started to implode back in 2014, the end of QE, then ZIRP which caused an epic move in the U.S. dollar as investors started to price in a higher interest rate environment. We may once again be on a similar precipice:
I don’t bring this up to suggest that Crude is about to retest $40, a level that seemed to spook investors of risk assets the world over in early 2016. But it’s worth considering how quickly traders headed for the door at the same time this week. That came alongside consensus agreement that the Fed will go ahead with its third rate increase in 10 years at next week’s meeting. Investors have been is a historically complacent lull for months, and they continue to be in equities. But that changed in oil yesterday. And don’t forget that vol can beget vol.