Retail stocks have been a big story in the market and on RiskReversal over the past year. We’ve written a lot about the challenges brick and mortar retailers face in the age of Amazon. And it’s been our belief that all of this ends with a lot fewer locations for department, big box and specialty retailers, a lot of empty shopping malls in the suburbs and eventually, a lot fewer ticker symbols as brands merge, shrink or disappear completely. It’s hard to find a name in the space whose stock hasn’t come under intense pressure on signs their customers are willing to buy those items online. Home Depot (HD) is probably the most notable example of a big box retailer who has yet to see the effects as the bulk of its products aren’t easily disrupted by online retail. Costco (COST) rode that same theme to recent highs, but the stock got hit on the most recent earnings. Since so much of COST’s product is food, it’s been able to avoid the Amazon kiss of death to this point, but Amazon is moving quickly into the fresh food delivery business, and at the end of the day Costco’s business model is about membership, and with Amazon Prime, COST may already be competing with Amazon more than we know, as they’re in a battle less over specific products they sell, but more on the limited amount of money people are willing to allocate to be a Costco or Prime member.
Another big box retailer, Target seems to be in big trouble, and the stock is in free fall. Walmart showed showed signs of life in its most recent earnings but the jury is still out on their aggressive moves online, it may be too little too late. Department stores stocks like Macy’s (M) have been a bloodbath with the exception of discounter TJ Maxx (TJX)
All that brings me to XRT, the S&P retail etf. The mix of stocks in this etf is fairly broad, and even includes names like Amazon itself, as well as PCLN, a stock that’s been doing well. From ETF.com, here’s the holdings in XRT grouped by sector:
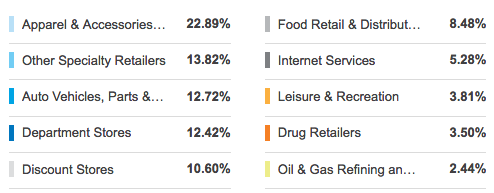
And here are the top 10 holdings themselves:
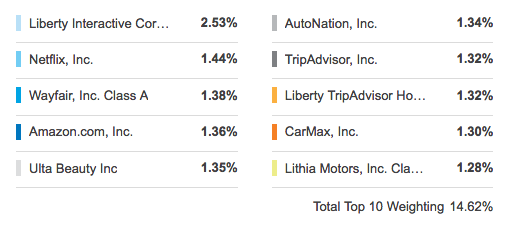
As you can see, there’s some big online players in that top 10 like Netflix (NFLX), Amazon (AMZN), Wayfair (W) and Tripadvisor (TRIP). As you go farther down the list you see more of the usual suspects like Costco, Walmart, Best Buy (BBY) and Staples (SPLS) but also Priceline (PCLN) and ETSY. The majority of the holdings are exactly what you think of when you think of retail, but there’s some mix of the companies stealing the others’ business. So the index can be thought of as a good proxy for the consumer overall, but with its weighting of way more retailers that Amazon is killing, than Amazon itself. In other words, Amazon is a threat to the index it is in.
So let’s look at XRT. It’s not a pretty chart over the past year, but for the reasons cited above, it’s not been the same bloodbath as an index as some of the single name stocks within it like Macy’s:
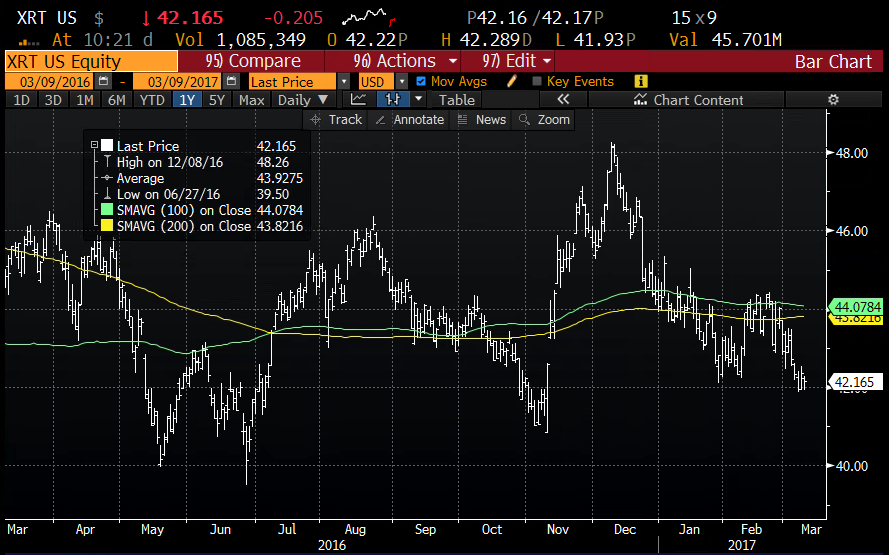
The XRT is sitting on some mild technical support at $42, with a fairly obvious bounce level back towards $44, right in between the etf’s 100 and 200 day moving averages. For those looking to press the trade on the short side a bounce to $44 may provide a good entry.
But for those who are convicted on lower lows from a fundamental standpoint in the space, the longer term chart is an absolute trainwreck. It has just broken the uptrend that has been in place from the 2016 lows, and a meaningful break here puts the high $30s in place, which would also be the neckline of an ominous head and shoulders top formation:
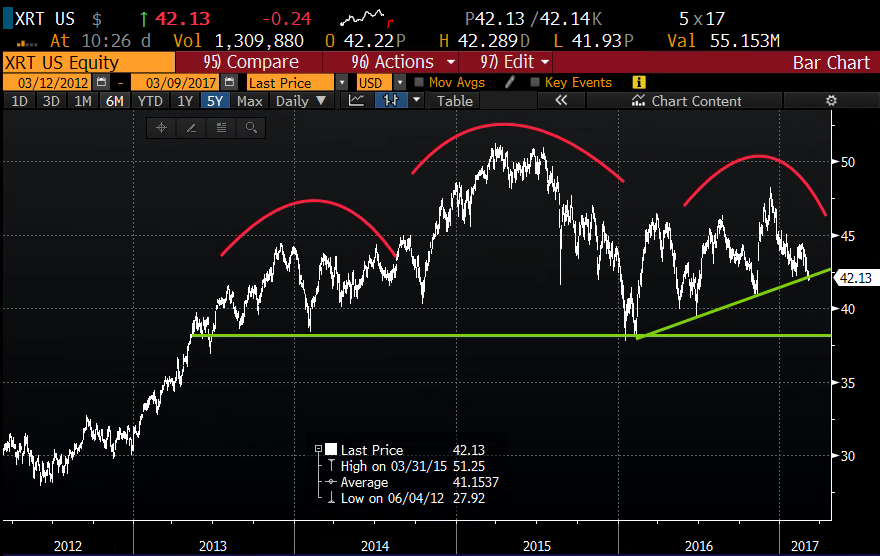
We’ll keep an eye on it. On a bounce we’d be likely to set up for a breakdown with defined risk.