MorningWord 3/8/17: It’s Not All Rainbows & Unicorns… But
by Dan March 8, 2017 9:39 am
• FREE ACCESS
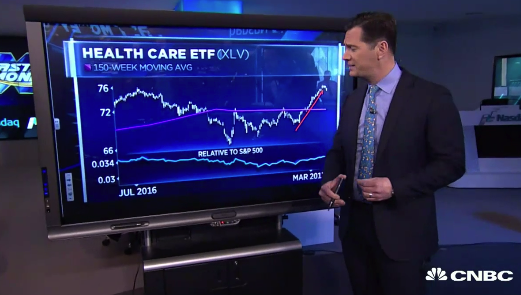
On CNBC’s Fast Money last night we had Technician Rich Ross from Evercore ISI. He looked at healthcare stocks, as they have been a “revelation” this year, second best preforming sector in the S&P 500 (SPX) behind Technology. He identified a handful of stocks in the group that look poised to breakout, watch here:
Rich highlighted the relative strength in the XLV, the Healthcare Select etf whose five largest holdings, JNJ, PFE, MRK, UNH & AMGN make up nearly 35% of its weight.
Porving that it takes two sides to make a market, I see something very different. Yesterday I posted a trade (Health Scare) on the XLV. Here were my thoughts:
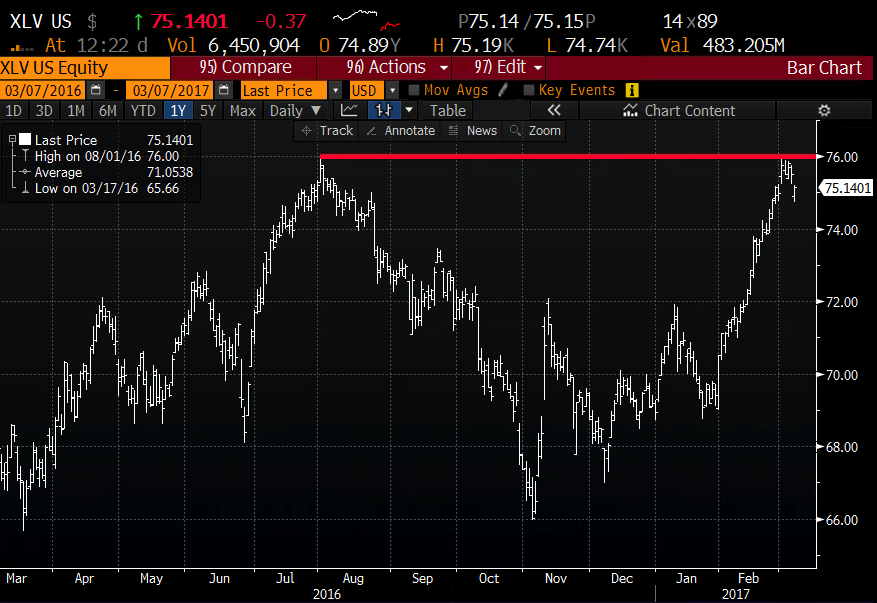
Not bad price action at all, but to my eye, $76 appears to be massive near term technical resistance:
XLV 1yr chart from Bloomberg
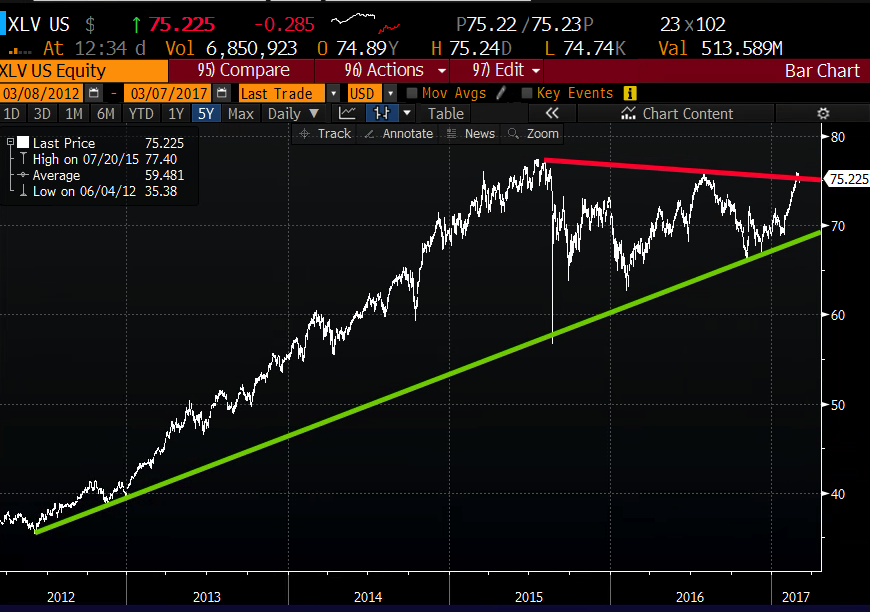
It’s a slightly different picture looking at the 5 year chart, with the etf having just broken above the downtrend that has been in place from the mid 2015 all time highs, after having bounced off of the long term uptrend that had been in place from the mid 2012 lows:
Bloomberg
Despite the decent price action, and the potential of a breakout above the downtrend, I’m far more inclined to play for a re-test of long term uptrend back towards $70, given the headline risk after such a sharp rally (up nearly 10% so far in 2017).
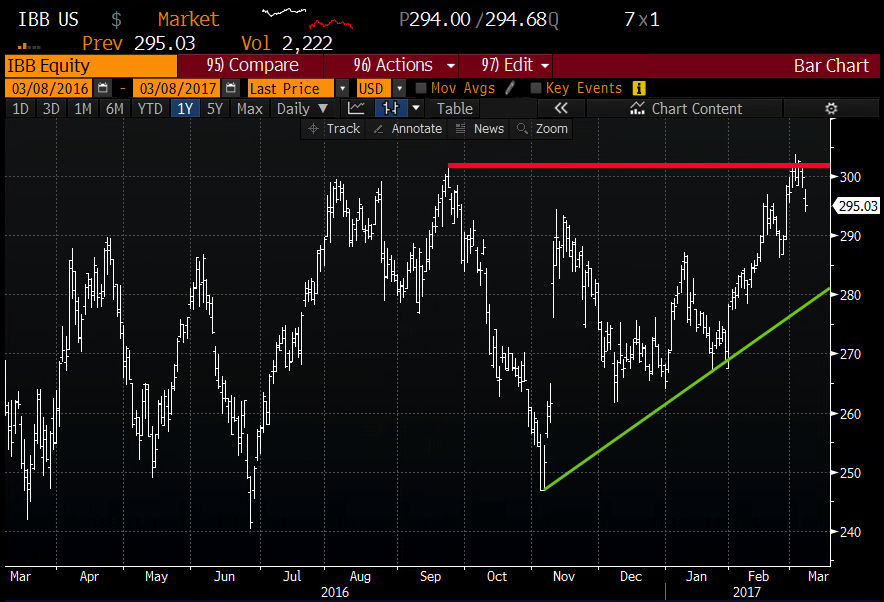
As Rich said “its not all rainbows and unicorns… but strength begets strength” in a bull tape. The relative strength in the space is nothing short of impressive given the regulatory and legislative headwinds, but I’m not sure playing for a breakout at prior resistance where most of the stocks/etfs that he highlighted have failed in the last year is the play here. I disagree with Rich’s take on the IBB, the iShares Nasdaq Biotech etf. To my eye the new 1year high last week, and for now the failure, looks to be a level traders can shoot against on the short side, possibly targeting $280, which happens to be the intersection of the uptrend from the pre-election November lows:
IBB 1yr chart from Bloomberg
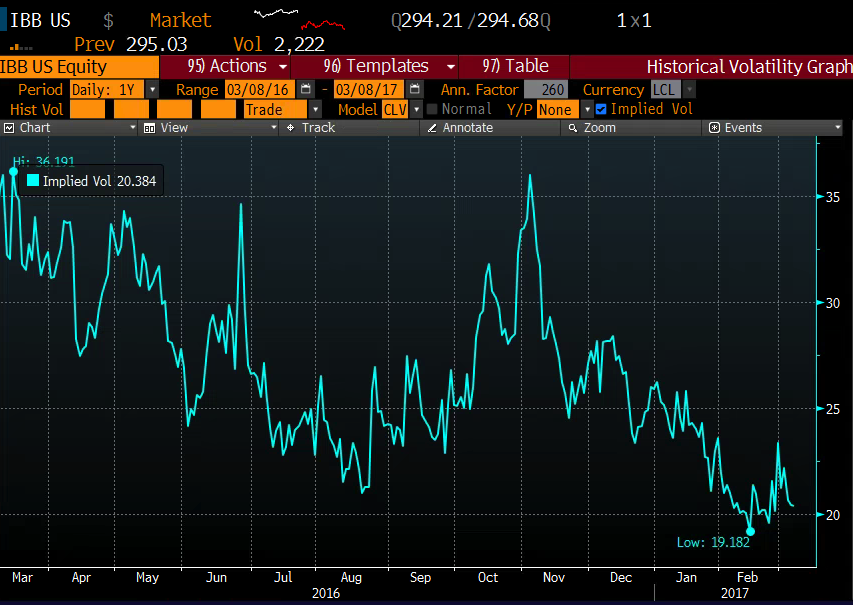
Much like the XLV, short dated options prices are cheap as chips for those looking to possibly hedge or replace longs with defined risk, or for traders to make outright directional bets:
IBB 1yr chart of 30 day at the money implied volatility from Bloomberg
The good thing about hearing two alternate opinions on the same space is that even those that agree with either viewpoint can use the skepticism of the other to keep stops tight or even better, define risk with a plan in case you’re wrong.