This is not the first time you have heard us say this, but reading too much into unusual options activity can be a big mistake for those inclined to follow along as it’s often unclear what the trader’s intent was and what their previous positioning was, other times it can even be a situation of the blind following the blind, even big traders can be wrong!
In Apple (AAPL) today, we’re seeing a ton of call activity, with calls outpacing puts more than 3 to 1 (so far.) Bloomberg had a blurb on their First Word function:
Apple Upside Calls Are Most Active in U.S. Equity-Options Market 10:39
[AAPL US 138.81, -0.97 0.69%]
Apple June $145 calls are the most active U.S. listed options in early trading.
• 2 blocks of 30k each appear to have been bought 10 minutes apart at $3.25 and $3.15 vs open interest of ~10k before today
• Strike is 3.7% above the last close
• NOTE: AAPL has 39 buys, 10 holds and 1 sell, avg PT $146: Bloomberg data
When I see a headline like that I do a little digging. Bloomberg data shows two prints of the same strike, same expiration, same size, 10 minutes apart, 1-0 cents different in price on two separate floors.
A broker on one of the floors, relays the following color to me:
AAPL jun 145 calls 30K trade 3.25 announced as an acct swap, prob from an OTC (over the counter) position to listed since OI (open interest) is less than trade
What does this mean to you and me? Probably nothing! A large institution moved a block of calls. Those calls look like they’re against some sort of OTC position that does not show in listed open interest.
Typically, monitoring unusual options activity gives us some sense that traders are at least looking at a stock or etf. In this case though, the supposed upside call activity that caught Bloomberg’s attention is probably nothing. But it got me looking at the chart.
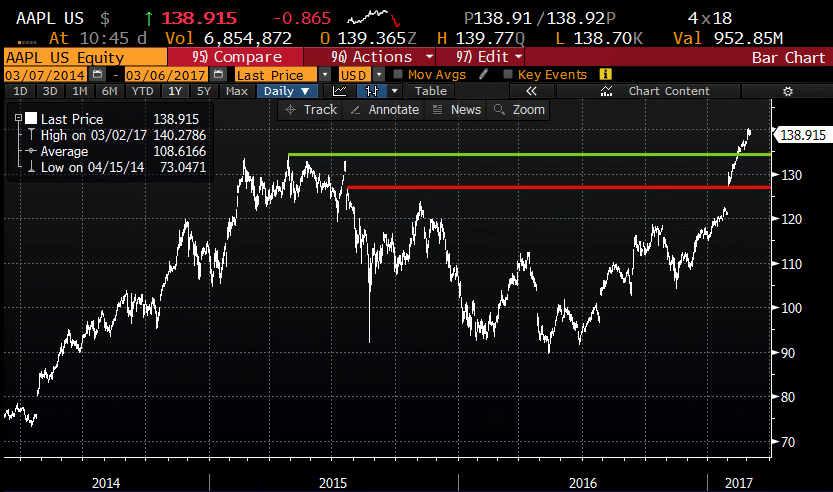
Here is what I see. Important support at the breakout from the prior 2015 high at $134.50, with $126.70 the next level of support (that was the July 2015 post earnings breakdown level that resulted in a more than 30% peak to trough decline into August, and it was also the January post earnings gap level). A breakdown below that and we likely see a gap fill:
The other interesting thing about AAPL options right now is the historically low level of implied volatility. June at the money is about 19.5 vol right now. May is about 20 and April is less than 16! Here’s how that compares to average 30 day implied volatility over the past 2 years:
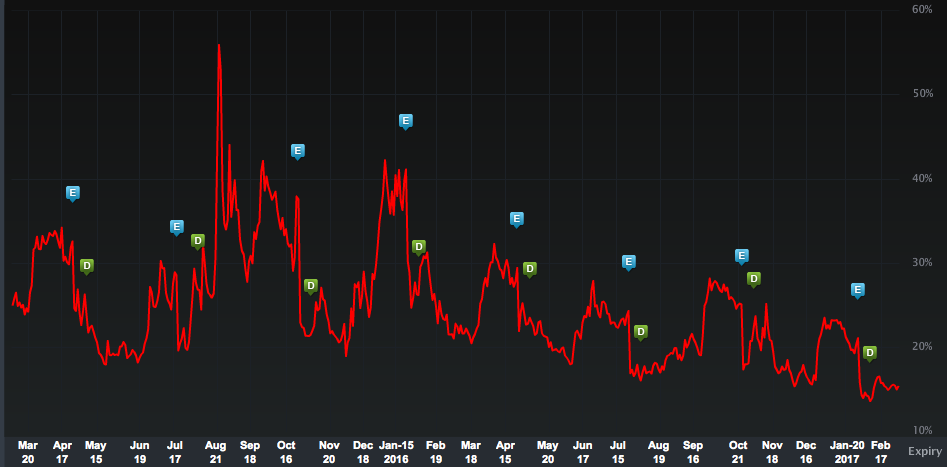
As you can see, smaller spikes into earnings and lower lows after. The fact that May and June, which both capture the company’s next earnings are below 20 is fairly unique historically. Expect that implied vol to creep up to at least the mid 20’s into the event, counteracting much of the decay for those initiating May or June stock alternatives or hedges now, looking out towards the next catalyst.