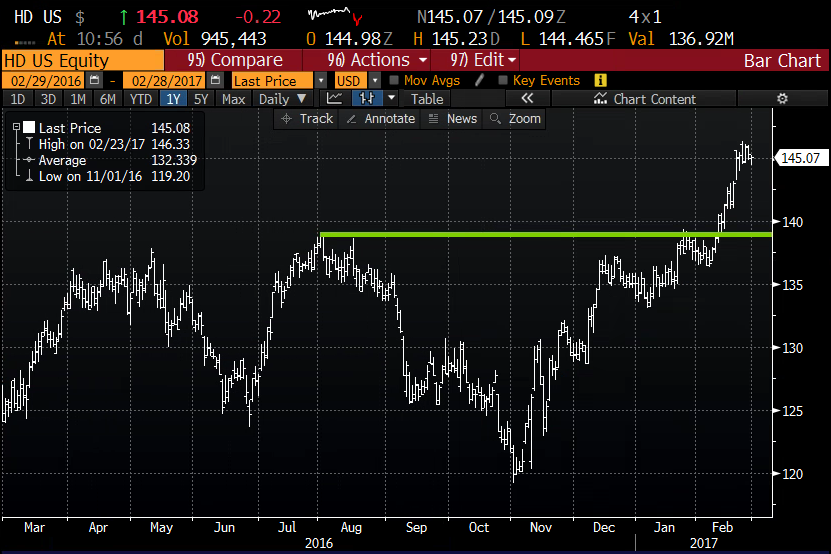
Target (TGT) shares are being taken out to the woodshed after a massive guide down for 2017 profits, and it’s dragging the whole sector down with it. On that kind of day it makes sense to take a peek at which stocks in the space that are somewhat immune to the wrecking ball that is Amazon.com (AMZN). Shares of The Home Depot come to mind, having just made a new all time high on Thursday, and only about 1% from those levels as I write. AMZN has yet to crack the home improvement nut, and they may never when you consider the barriers to entry for the bulk of goods sold at HD (although I’m sure they’re working on it!).
For fiscal 2018 (current year), analysts expected 11% year over year eps growth (a deceleration from last year’s 17% eps growth), which could prove conservative as it is the slowest growth rate since f2010’s 7% decline. Trading 20x expected 2018, the stock is not exactly expensive vs expected growth, and the forward P/E of the S&P 500 (SPX), which is nearing 18x, especially if current estimates prove to be conservative.
All that said, the stock’s breakout this month could be a tad overzealous, and pullback to breakout could be in the cards on the slightest bout of broad market volatility:
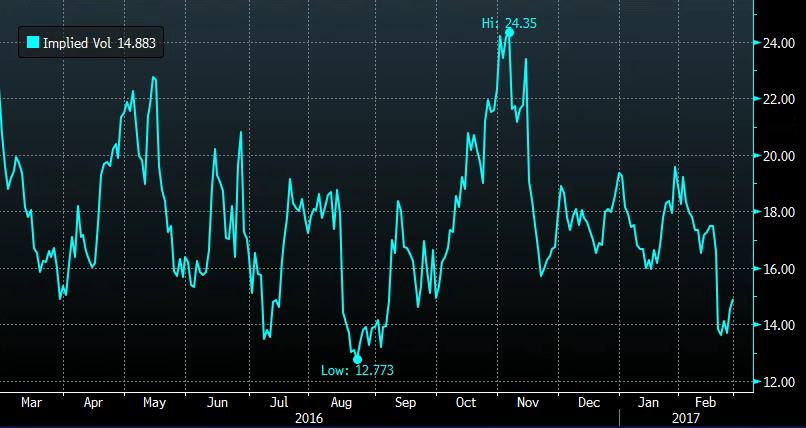
Short dated options prices have come crashing lower since earnings with the slow grind higher in the stock, and a few points from the 52 week lows, with 30 day at the money implied volatility at about 15%, well below the November highs of 24%:
So What’s the Trade?
The next identifiable catalyst is FQ1 results on May 16th. If I were long, I would consider stock replacement strategies near term, selling all or a portion of my position at $145.25 to buy a call butterfly with realistic upside but defined risk of just 2.50
HD ($145.25) Buy the May 145/ 155 / 165 call butterfly for $2.50
- Buy to open 1 May 145 call for 4.30
- Sell to open 2 May 155 calls at 95 cents each (1.90 total)
- Buy to open 1 May 165 calls for 10 cents
Break-even on May expiration:
- Losses of up to $2.50 between 145 and 147.50 & between 162.50 and 165, with total loss of $2.50 above 165, or below 145
- Gains of up to $7.5 between 147.50 and 162.50 with max gain of $7.50 at 155
Or If I were inclined to hold onto stock, but play for a short term pullback to $140, (or outright bearish) I would consider the following trade idea to isolate that level near term, but avoiding earnings:
HD ($145.25) Buy the April 145/ 140 / 135 Put butterfly for $1
- Buy to open 1 April 145 put for 3.50
- Sell to open 2 April 140 puts at 1.60 each (3.20 total)
- Buy to open 1 April 135 calls for 70 cents
Break-even on April expiration:
- Losses of up to $1 between 144 & 145 and between 135 & 136, with total loss of $1 above 145, or below 135
- Gains of up to $4 between 146 and 1136 with max gain of $4 at 140