Following Target’s (TGT) negative pre-announcement of their fiscal Q4 results on Jan 18th I had the following to say on the stock:
But what’s also shocking is that TGT’s market cap is now half of their 2016 sales of almost $71 billion. That $71 billion is half of Amazon’s (AMZN) $137 billion in sales, yet Amazon (now) sports a market capitalization of $384 billion! The market is forward looking and it doesn’t think this trend will slow.
So what can Target do? They still do 95% of their sales in their stores. I suspect TGT will be forced to spend in 2017, the way Walmart did in 2016. Walmart paid $3.3 billion for Jet.com, a two year old e-commerce company that had less than $200 million in sales last year. They also sold their online business in China to JD.com, the number 2 retailer in the country behind Alibaba, and doubled their stake in JD.
For the stock now, weak earnings and sales, coupled with the strong potential for greater spending means continued pressure on the stock and a possible breach of long term support in the not too distant future.
This morning the stock is down 12% after officially reporting Q4, but more importantly it was coupled with a massive clip to expected 2017 earnings, per WSJ:
for 2017, Target said it expects adjusted earnings in a range of $3.80 to $4.20 a share. Analysts, polled by Thomson Reuters, expected $5.34 in per-share earnings. The company also forecast a low-single-digit decline in comparable sales.
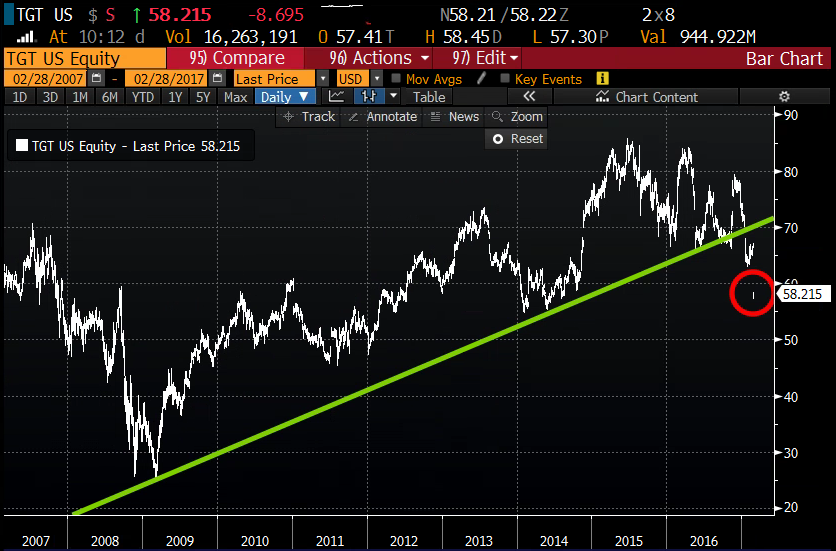
The 10 year chart of TGT below shows the Jan gap on the pre-announcement as a significant technical break of the uptrend that had been in place since its 2008/2009 Financial Crisis lows. Your guess is as good as mine whether the stock finds technical support near the 2014 lows that corresponded with their aftermath of their data hack from the prior year:
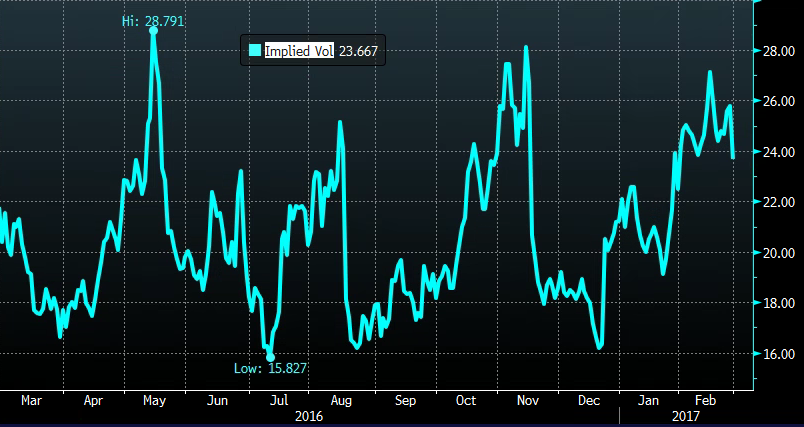
Short dated options prices have been elevated since the start of the year, but if the stock were to find some support soon in the mid to high $50s they should settle a bit, if that were the case, selling short dated options to finance longer dated ones, for those with a directional view could be the way to play:
So What’s the Trade?
For those that were long the stock, are feeling trapped and just want to bail on the first rally, vol remains elevated and offers an opportunity to leverage a sale on a small bounce:
Leverage for existing stock
vs 100 shares of an existing long in TGT ($59) Buy the April 60/62.5 1×2 call spread for .10
- Buy 1 April 60 call for 1.60
- Sell 2 April 62.5 calls
Break-even on April expiration: Loss of .10 below 60. Gains of up to 2.40 at or above 62.50. Above 62.50 called away but at an effective sale price of 64.90
Rationale – This overlay for existing stock adds up to 2.40 in leverage on a bounce. It’s perfect for those looking to get out of a difficult situation because on a bounce you can raise the effective level of your sale of shares.
We’re not sure even now it the time to be bottom picking, risk seems to remain down to at least the mid 50s. But for those looking to play for a bounce outright, the elevated vol provides an opportunity to finance longer dated calls, with defined risk:
Bullish/ Stock Alternative
TGT ($59) Buy the March/ May 60 calendar for 1.30
- Sell 1 March 60 call at 1.00
- Buy 1 May 60 call for 2.30
Break-even on March expiration/ Rationale – This trade does best of the stock settles in around the $60 level on expiration in two weeks. The March 60 calls could then be rolled to a higher strike in May to further reduce premium at risk. If the stock continues to tank from here, the most that can be lost is 1.30. If the stock bounces hard in the next 2 weeks the position will have to be adjusted quickly as it is short deltas with the stock above 60 until the short March calls expire.